This is the second part of the analysis of microstock contributor survey of 2024. We asked around 30 questions via Xpiks website, MicrostockGroup forum, Facebook pages and collected incredibly interesting data. While the first part focused on earnings and business practices, this part focuses on content, portfolio, keywording and AI.
About this survey
Big “Thank you!” to every contributor who filled out the survey! Without you it wouldn’t be possible.
Microstock contributors, surveyed by Xpiks, include close to 250 members:
- from
59countries around the globe - from barely any and up to more than
15years of experience in the industry - having tiny portfolios or up to more than
50,000assets - earnings from less than
$100per month to more than$5,000per month - working from less than
8hours per week to full-time - creating all sorts of content
Content analysis
General content statistics
Respondents to this survey create the following kinds of content:
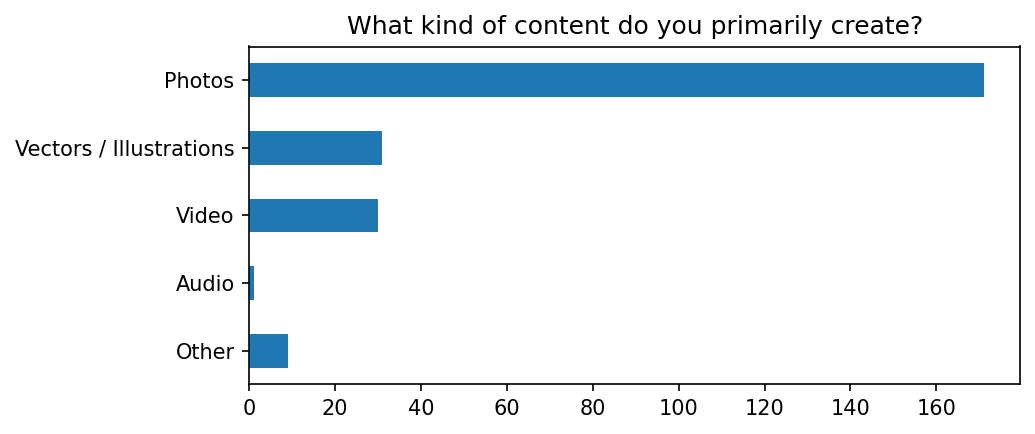
“Other” category, which is surprisingly large, included such things as 3D renders, PSD files, Motion Graphics and “AI content”. Besides than that, vast majority (~70%) of respondents sell photos. Vectors and videos are mostly even and significantly smaller than photos - this is also what we see in Xpiks usage.
When mapped on earnings though, photos earn less and less money for people on higher earnings tiers.
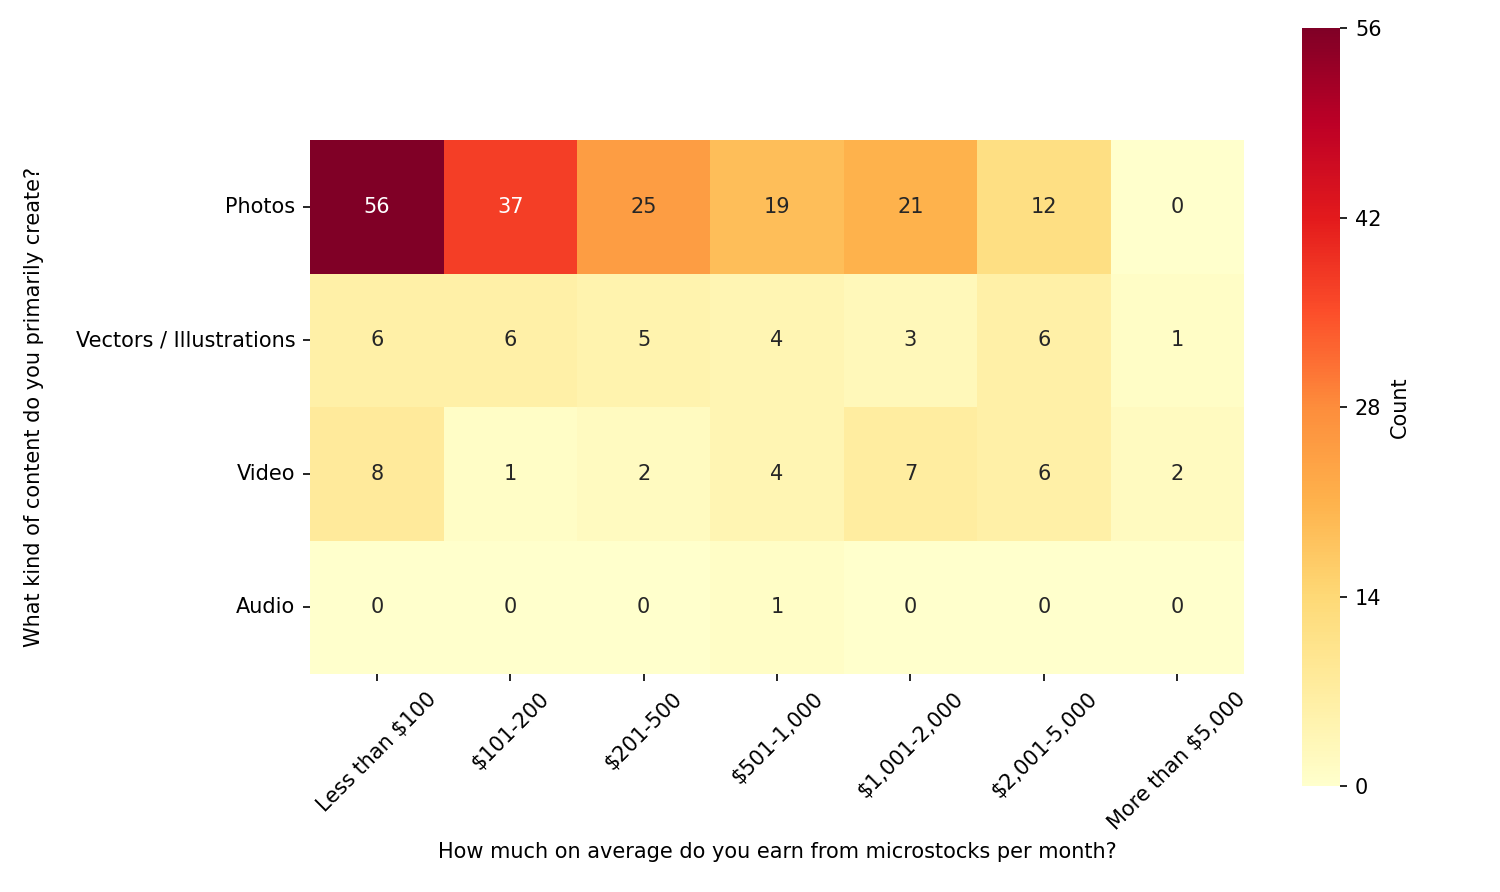
Vectors seem to be very stable in terms of their effect on your earnings and videos are more “rewarding” on higher-earnings earnings tiers. One way to explain the gap in video income in the range of $100-500 (few tiers) is that when people figure video out, they relatively quickly jump over to higher earnings.
Content topic research
There were few survey questions about content research as, in my opinion, it is such an important part of success on microstocks.
Kinds of research
When asked how people mainly come up with what content to create, most of them (62%) still create what they want:
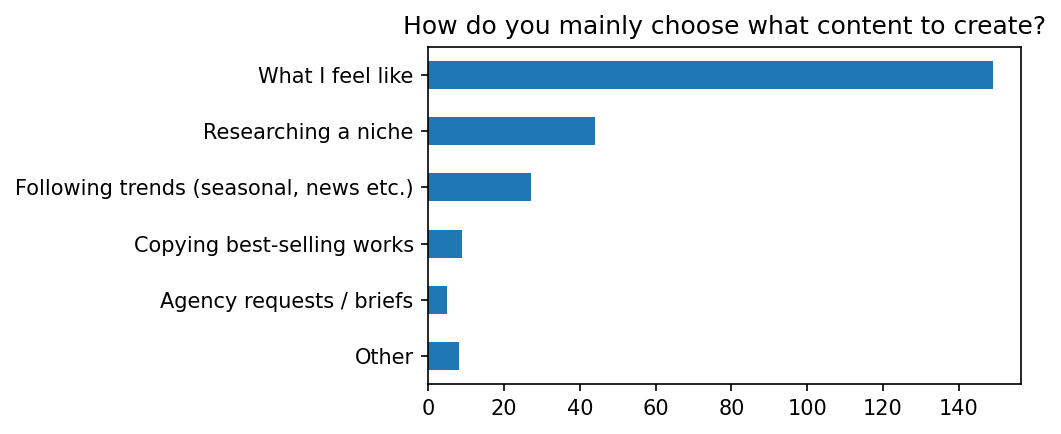
“Other” category included “All of the above”, “Copying from MidJourney gallery”, repurposing other content (e.g. creating stills from video).
Impact on earnings
However, interesting insights show up when you map that on the reported earnings:
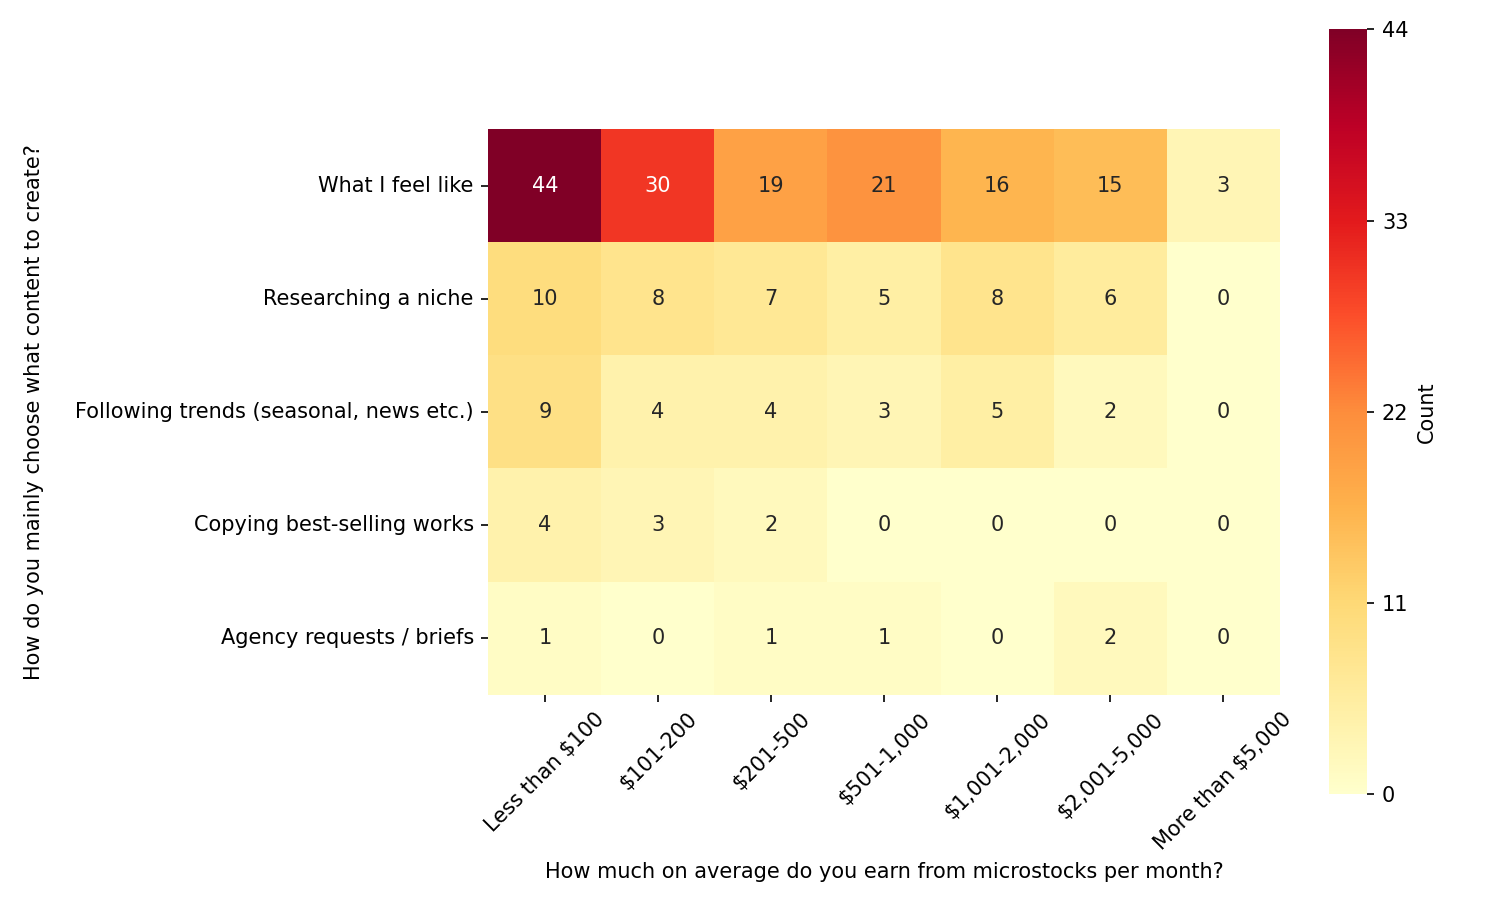
It’s hard to overstate how important this chart is! First of all, creating “what you feel like” does work even for high earners, so you can YOLO your way to the top! However, it works less and less the more money you earn. Which, in my opinion, is the lesson you need to take from it.
“Researching a niche”, “Following trends” and “Agency briefs” seems to be very stable in terms of impact of different earning tiers. They all are leaning much more toward what customers actually need and it shows! From those, “Agency briefs” seems to be the least impactful and “Researching a niche” - the most impactful.
And, funny enough, “Copying best-sellers” slowly diminishes from the start and completely stops working relatively early ($200-500). This is either good news or a selection bias for this survey respondents. Either way, it can work in the beginning, but it is clearly not a long-term strategy, not even to mention the moral side of it.
Impact on earnings trend
Contributors also reported earnings trends (earnings increased, stayed the same or decreased) for the 2024 and we can intersect that with the research too:
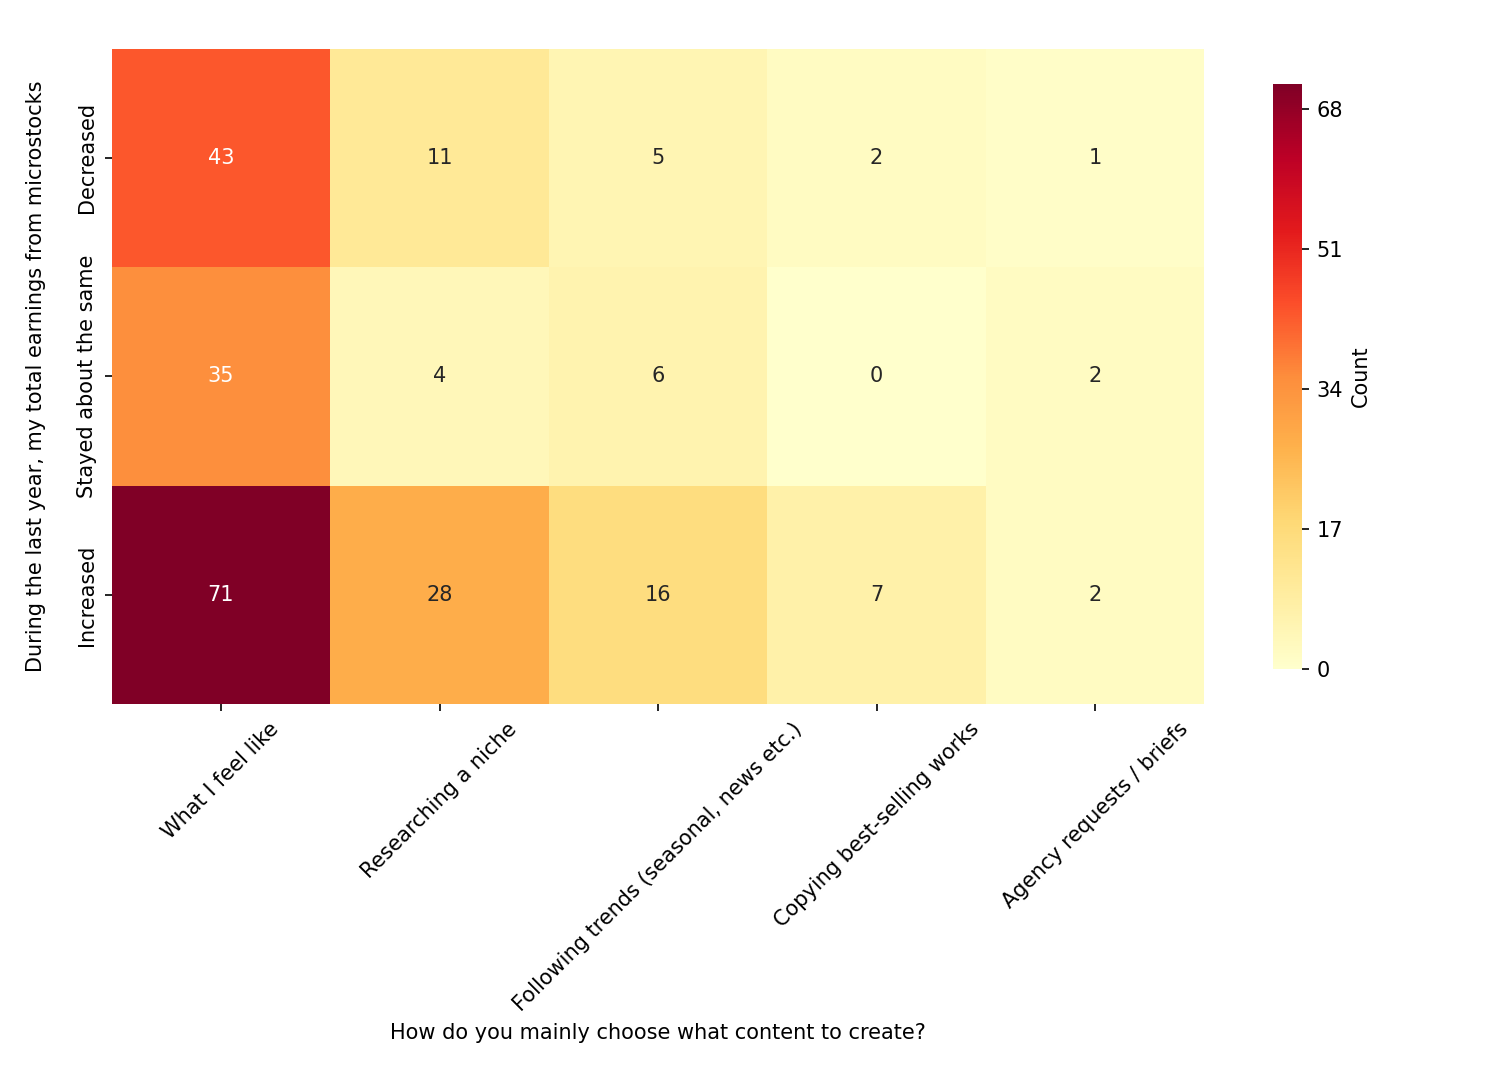
Although it could be tricky to read this chart, the way I offer is to see if “Increased” category beats “Same” plus “Decreased” for a given method.
For example, “What I feel like” category stays mostly even: about as many people report increased earnings (71) as people with “same or lower” (43+35). However, “Researching a niche”, “Following trends” and “Copying best-sellers” is much more on the “Increased” side of things than the sum of “Decreased” and “Same”! Being more statistically significant, to me it suggests those strategies being premium to others.
Portfolio analysis
Microstock agencies used
Most popular agencies’ results are not quite surprising:
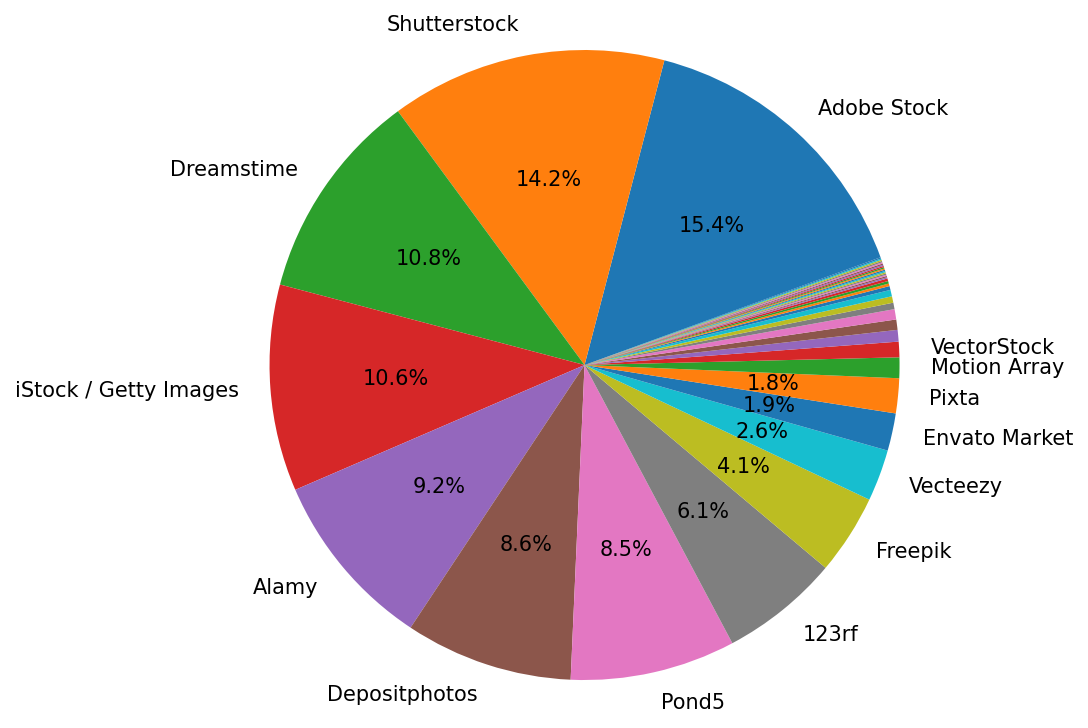
The top agencies, used by contributors, are:
- Adobe Stock (
15.4%) - Shutterstock (
14.2%) - Dreamstime (
10.8%) - iStock / Getty Images (
10.6%) - Alamy (
9.2%) - Depositphotos (
8.6%) - Pond5 (
8.5%)
Shutterstock and Adobe Stock are the top 2 (about 15% each) with the large margin from others (clumped ~10%). It is surprising that iStock is still holding on so high on the ranks, given how little it is paying on average nowadays.
If you followed the previous part, you know that, in terms of diversification, most income receive contributors who target 5-8 different agencies. If you questioned which agencies those should be, now you know.
Portfolio size
General statistics
Respondents to this survey have mostly evenly distributed portfolio sizes (except the giant ones) which makes them very interesting for the analysis.
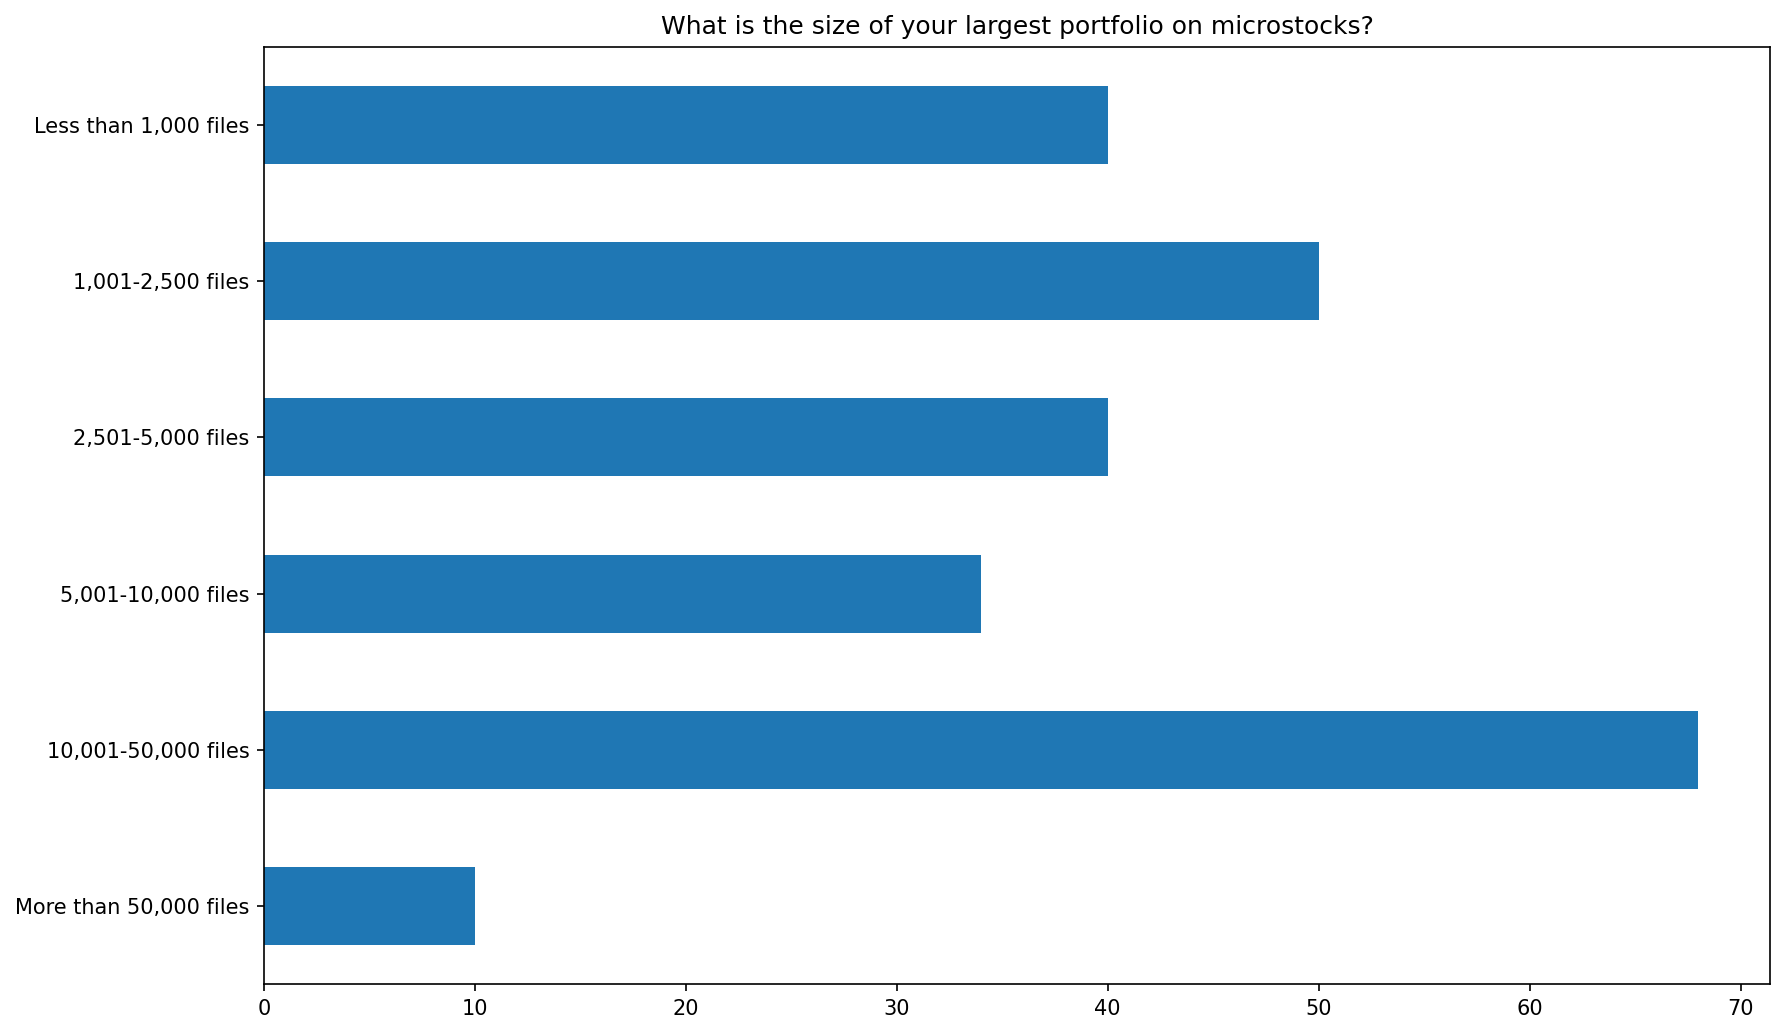
It is surprising that 32% amassed portfolios with more than 10,000 files! Given, that the first part of the analysis revealed that respondents are mostly very experienced contributors, many of whom have more than 10 years of experience in the field, it actually makes sense.
It is interesting to see how many years it took to create such a feat.
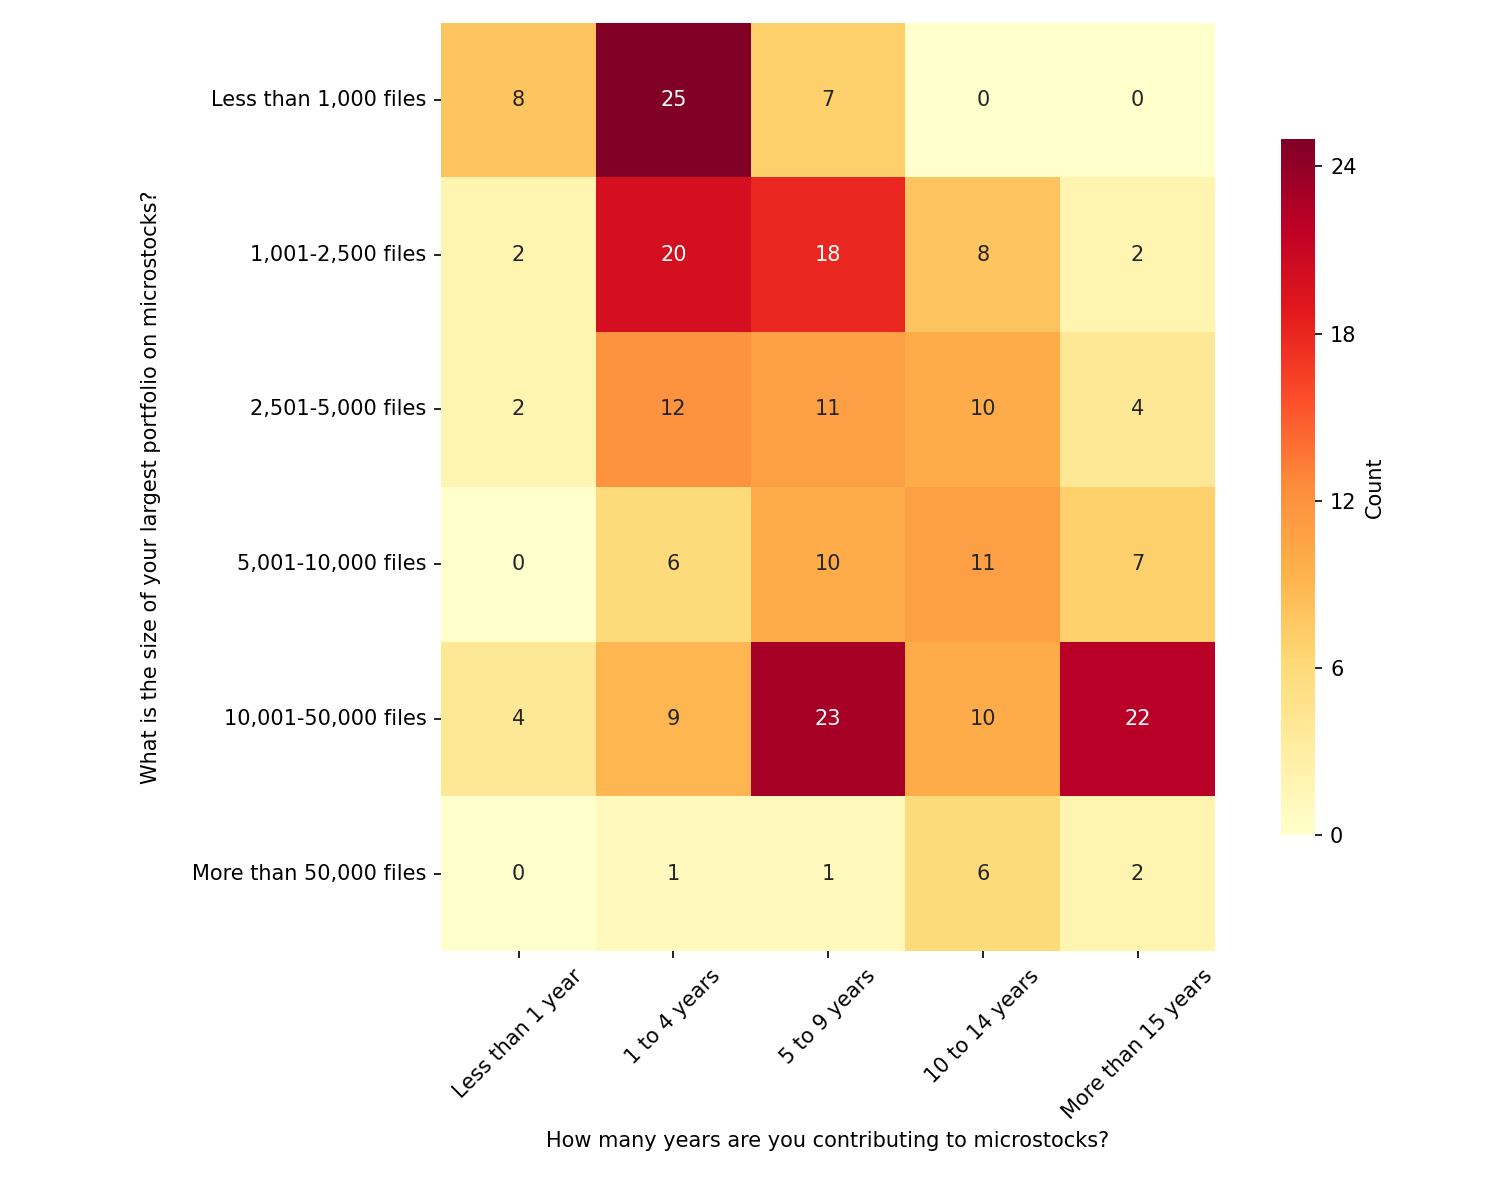
Again, if you squint your eyes, you might notice the “diagonal”, that pretty much means linear (logical) growth of portfolio size with years of experience. People with 1-4 years can reasonably expect to produce up to 2,500 files; 5-9 years have a bucket-like shape, with peaks at edges of the spectrum and enormous-sized portfolio were mostly made after 10 years in the field.
However, it’s the outliers that are interesting! Apparently, there were accounts over 10,000 files (and even over 50,000 files) that were made in a relatively short time. While we can only guess how was that possible (importing portfolio from another agency? working in a huge team?), it would be fascinating to interview those people.
Effect of size on earnings
Next logical thing to evaluate is how portfolio size affects your earnings:
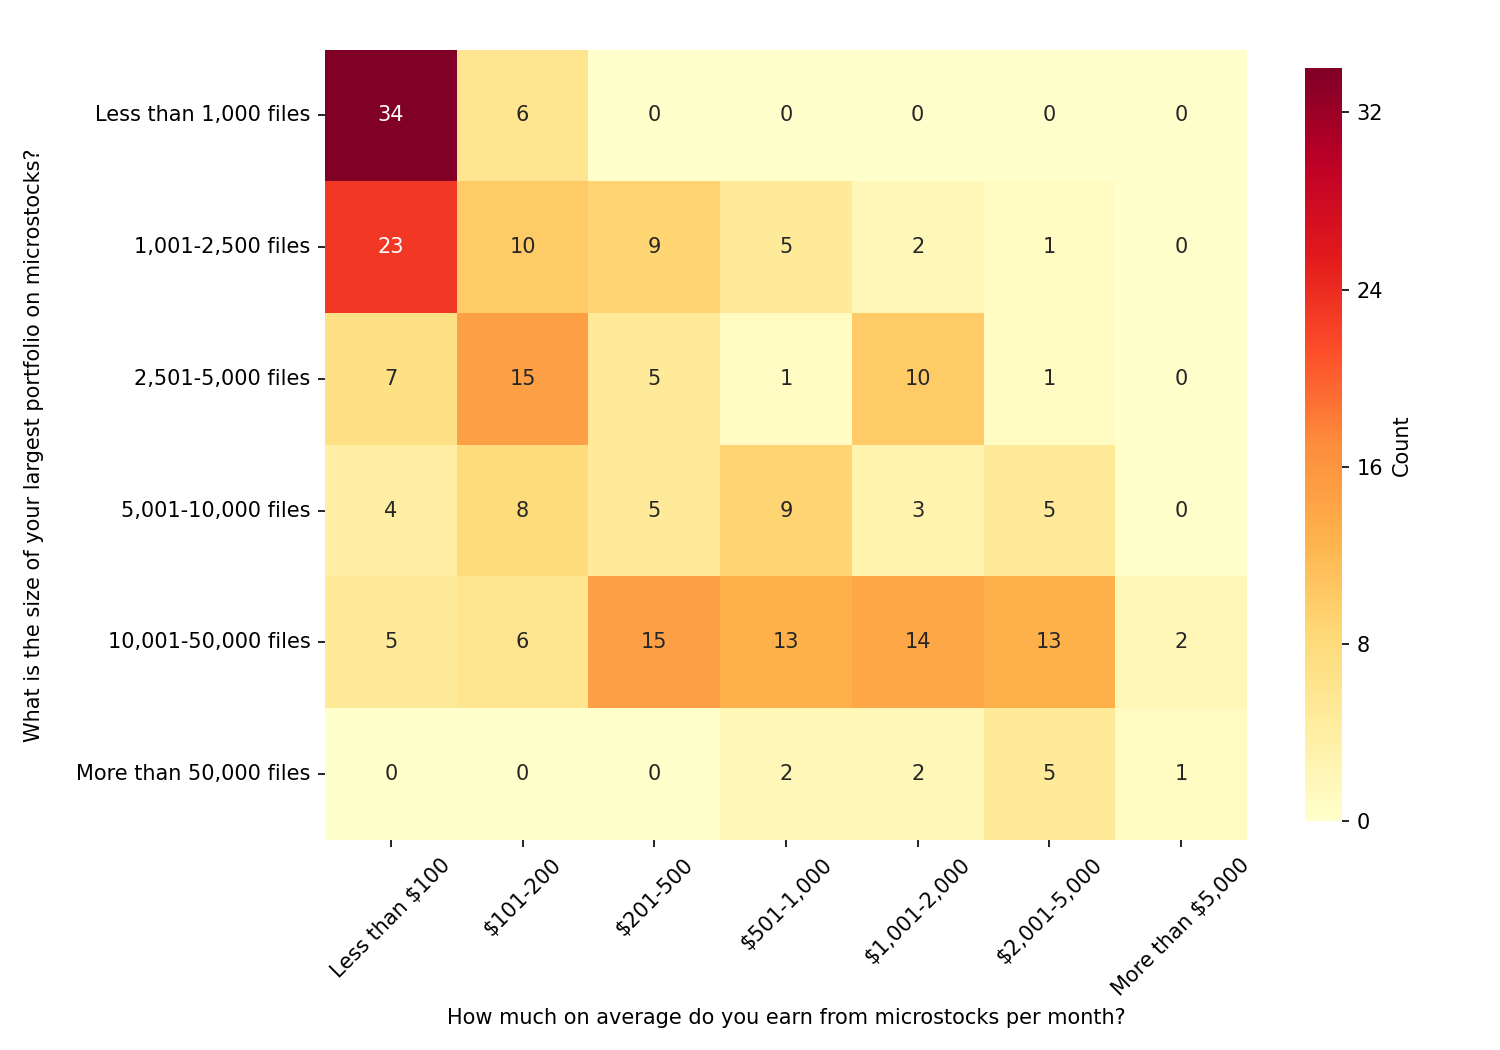
There are so many clear correlations here! With less than 1000 files in your portfolio, you can only reasonably expect to earn up to $100 per month (only a few outliers earn up to $200 per month). Even the majority of people with up to 2,500 files in their portfolio are still stuck on $100. However, this is the threshold where people actually start to earn decently (albeit with fewer and fewer chances).
Then, things get a bit messy in the next 2 steps. Contributors with up to 5,000 files seem to either be still stuck on $200 per month or staying safely in the $1,000-2,000 range. To me that signals if they “cracked the code”, rather than “increased portfolio size”. And similar mess in the 5,000-10,000 files does not show any consistency in the earnings buckets.
Only when we get to the 10,000+ portfolio size, it consistently sits in the highest-earning buckets almost equally. Microstock tycoons with 50,000 and more files are also exclusively in the high-earning buckets, however, there are just fewer of them.
Team versus individuals
One natural question, from the portfolio analysis is if it’s possible to amass such a large portfolio yourself or you need a team. And we have a clear answer!
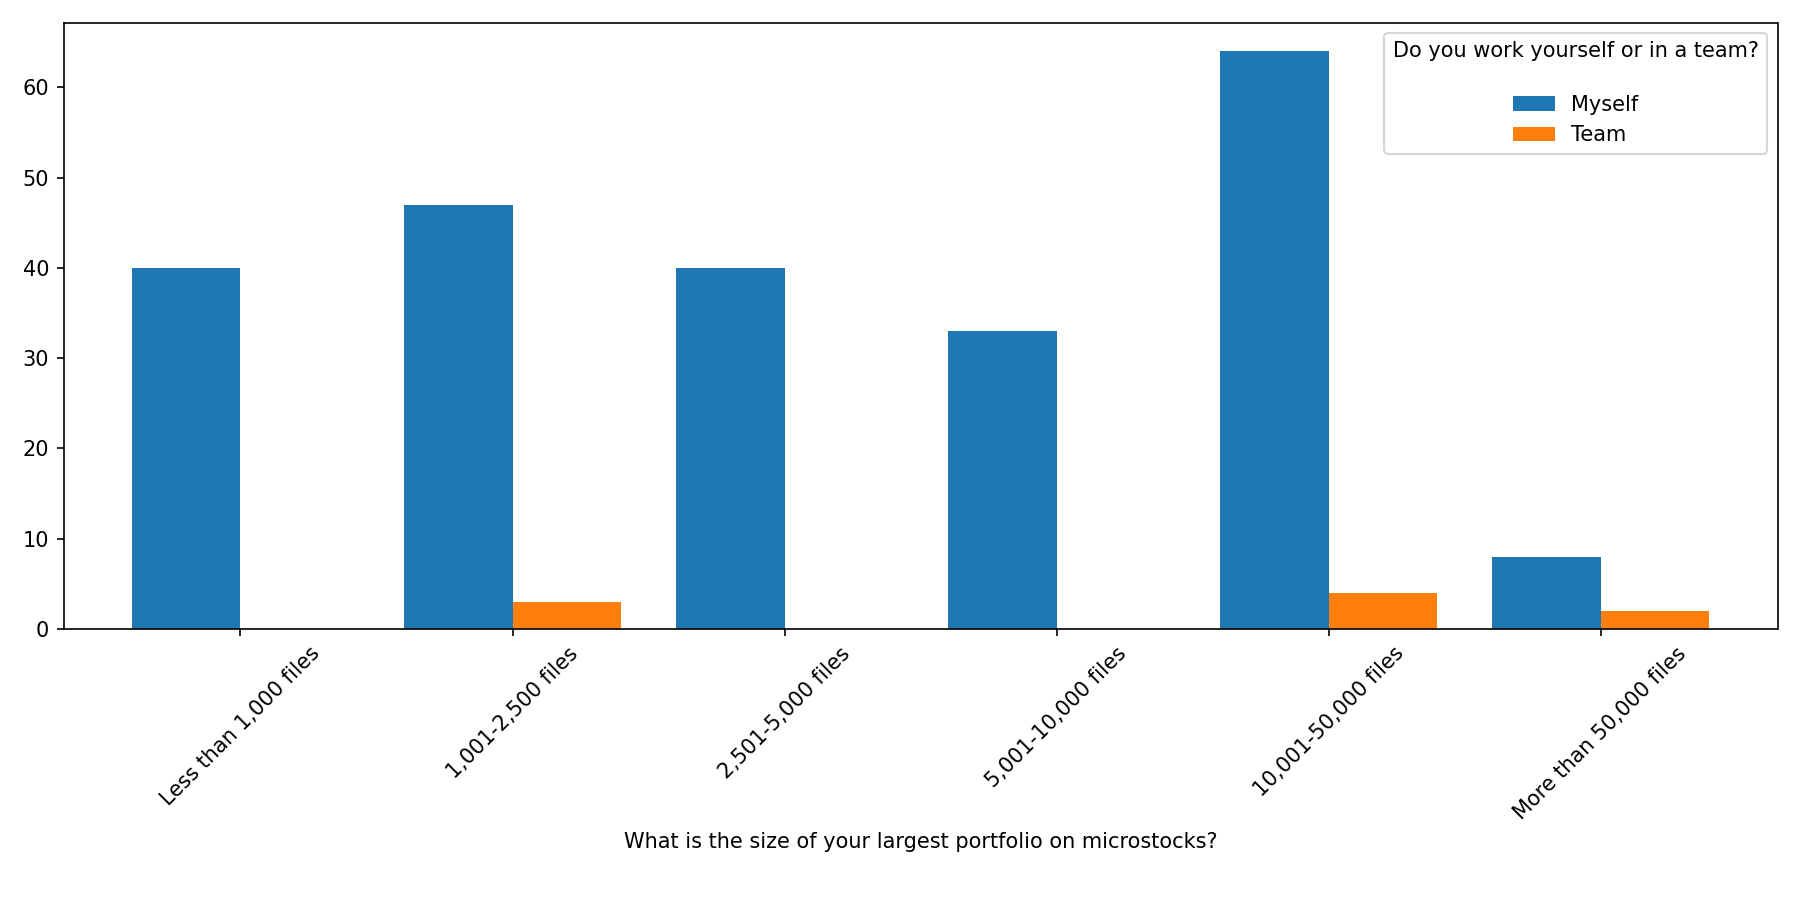
As you can see, those large portfolios were mostly created individually. Teamwork was an insignificant exception, rather than a rule. For 50K+ sized portfolios the team percentage is higher, but still not even close.
Keywording
It’s hard to overestimate how important good keywording is. Now we can actually quantify it better.
General keywording analysis
The first thing we asked contributors was how do they do keywording in the first place:
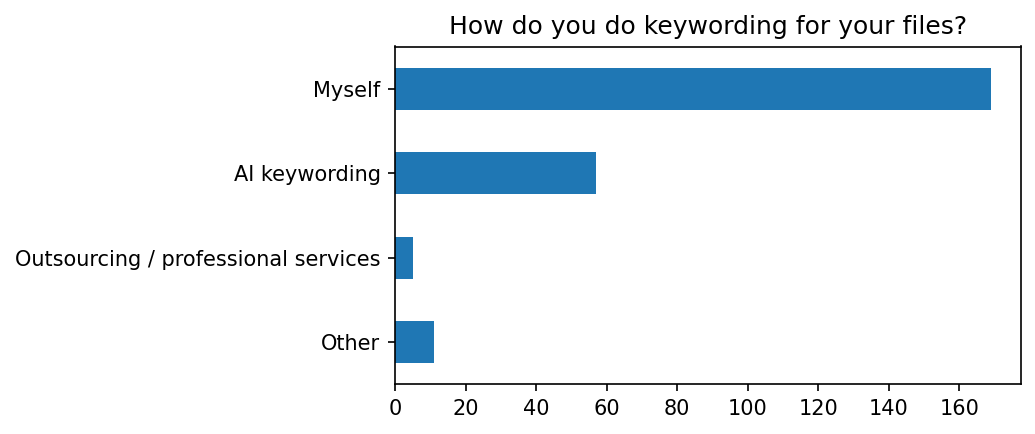
The vast majority (close to 70%) do keywording themselves, not using tools or services. The “Other” category includes some specific tools (e.g. “ChatGPT”), using agencies that do keywording for you (e.g. Blackbox) or using agency-provided tools (e.g. Shutterstock/Adobe Stock can offer you “free” AI keywords).
What could be interesting here is to see if the way people do keywording is affected by the number of working hours they dedicate (see the first part of the analysis for details):
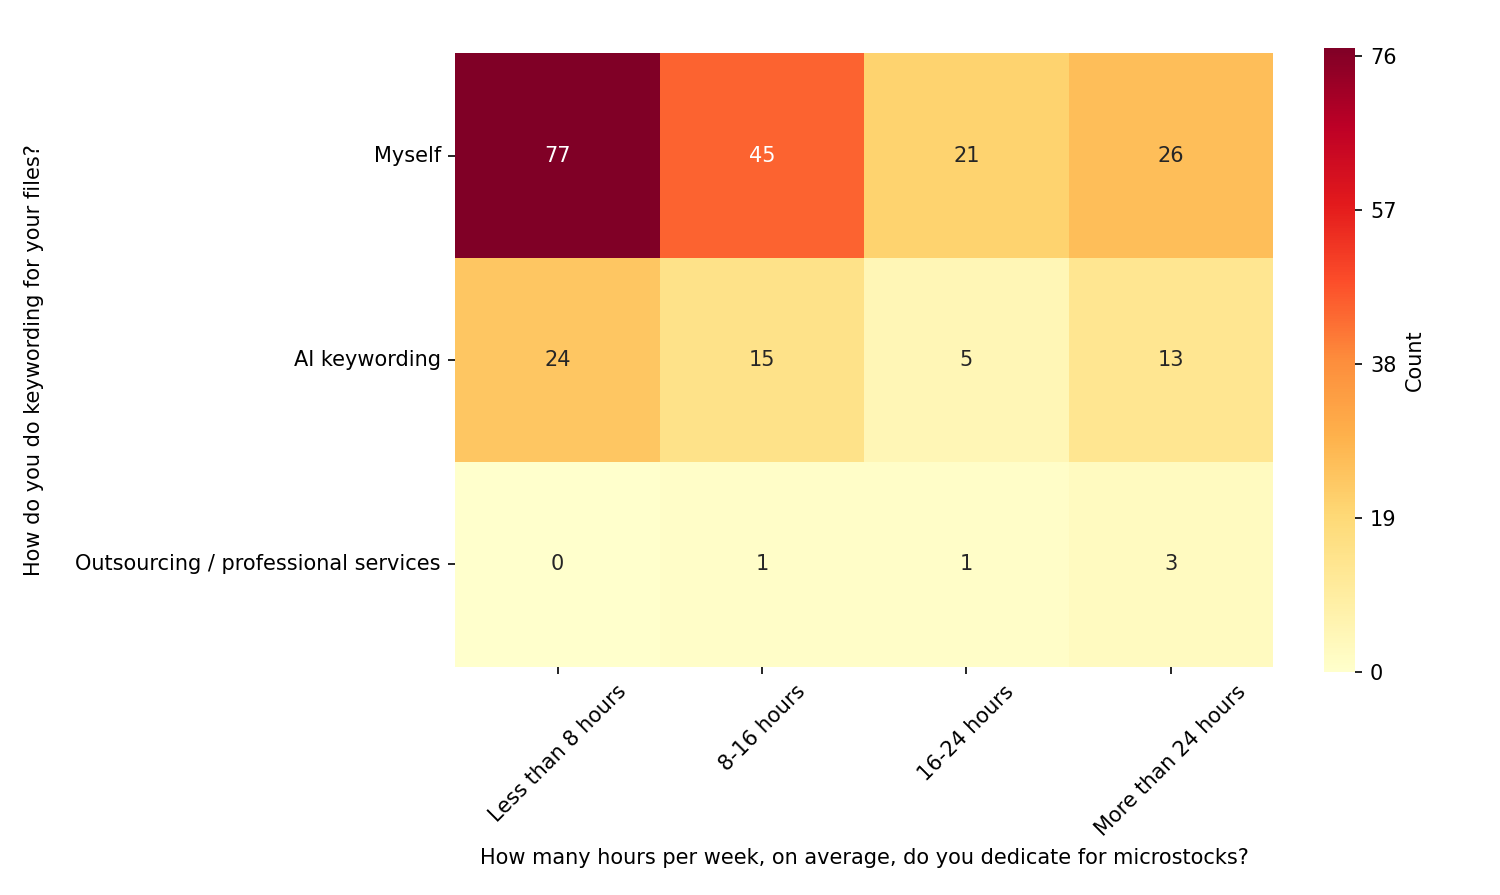
In all time slots, it seems, people keep keywording mostly themselves without getting “lazy” or “overproductive”. “AI keywording” is also quite stable in the usage data. Only “Professional services” are clearly more used by people who work “full time” on microstocks, but is not representative enough.
Effect of keywording on earnings
Keywording obviously affects earnings, but how much?
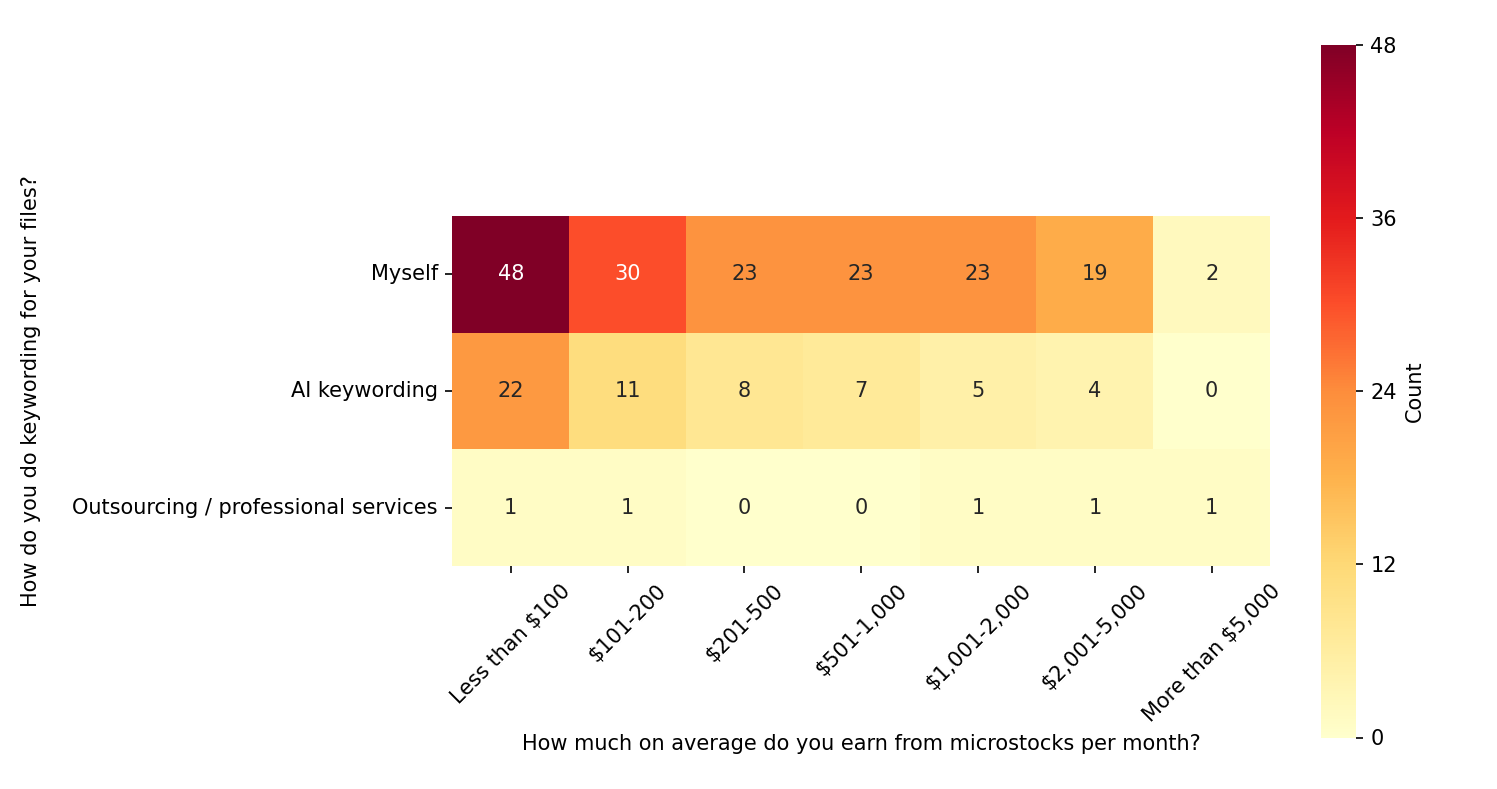
Interesting to see how AI keywording use is lessening when going to higher-earnings tiers (and rightfully so, as AI does not do the best job yet). “Manual” keywording is staying absolutely stable in all earnings tiers, after the peak of low-earners. It shows that there are people in all earnings tiers who care about sales.
Another angle how this can be explored to see how people do keywording when their portfolios grow:
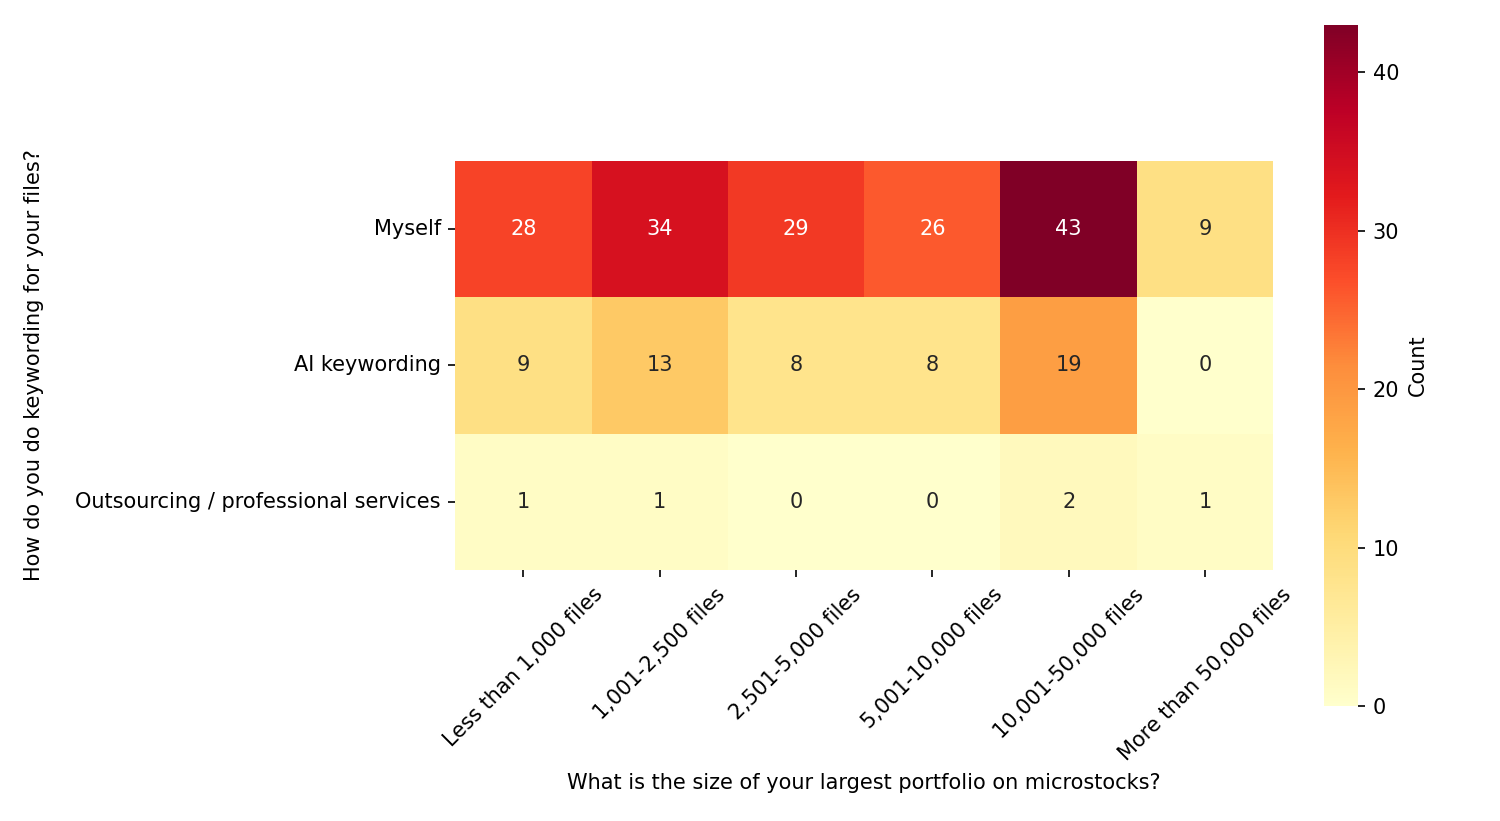
The unexpected peak of “manual” keywording is at the portfolio size of 10,000-50,000 files. Unbelievably (good!) that people with that portfolio size care about keywording. Or, maybe, they were able to collect such portfolios because they cared about keywording in the first place so good sales allowed them to stay in the game.
Use of “AI” for microstocks
Using AI-tools (except of content creation)
Contributors were asked if they use “AI tools” besides creating content:

“Nay”-sayers are winning so far, having 60% in total, but about half of them are planning to try “AI tools”.
Here’s the picture of the earnings trend of AI tools through 2024:
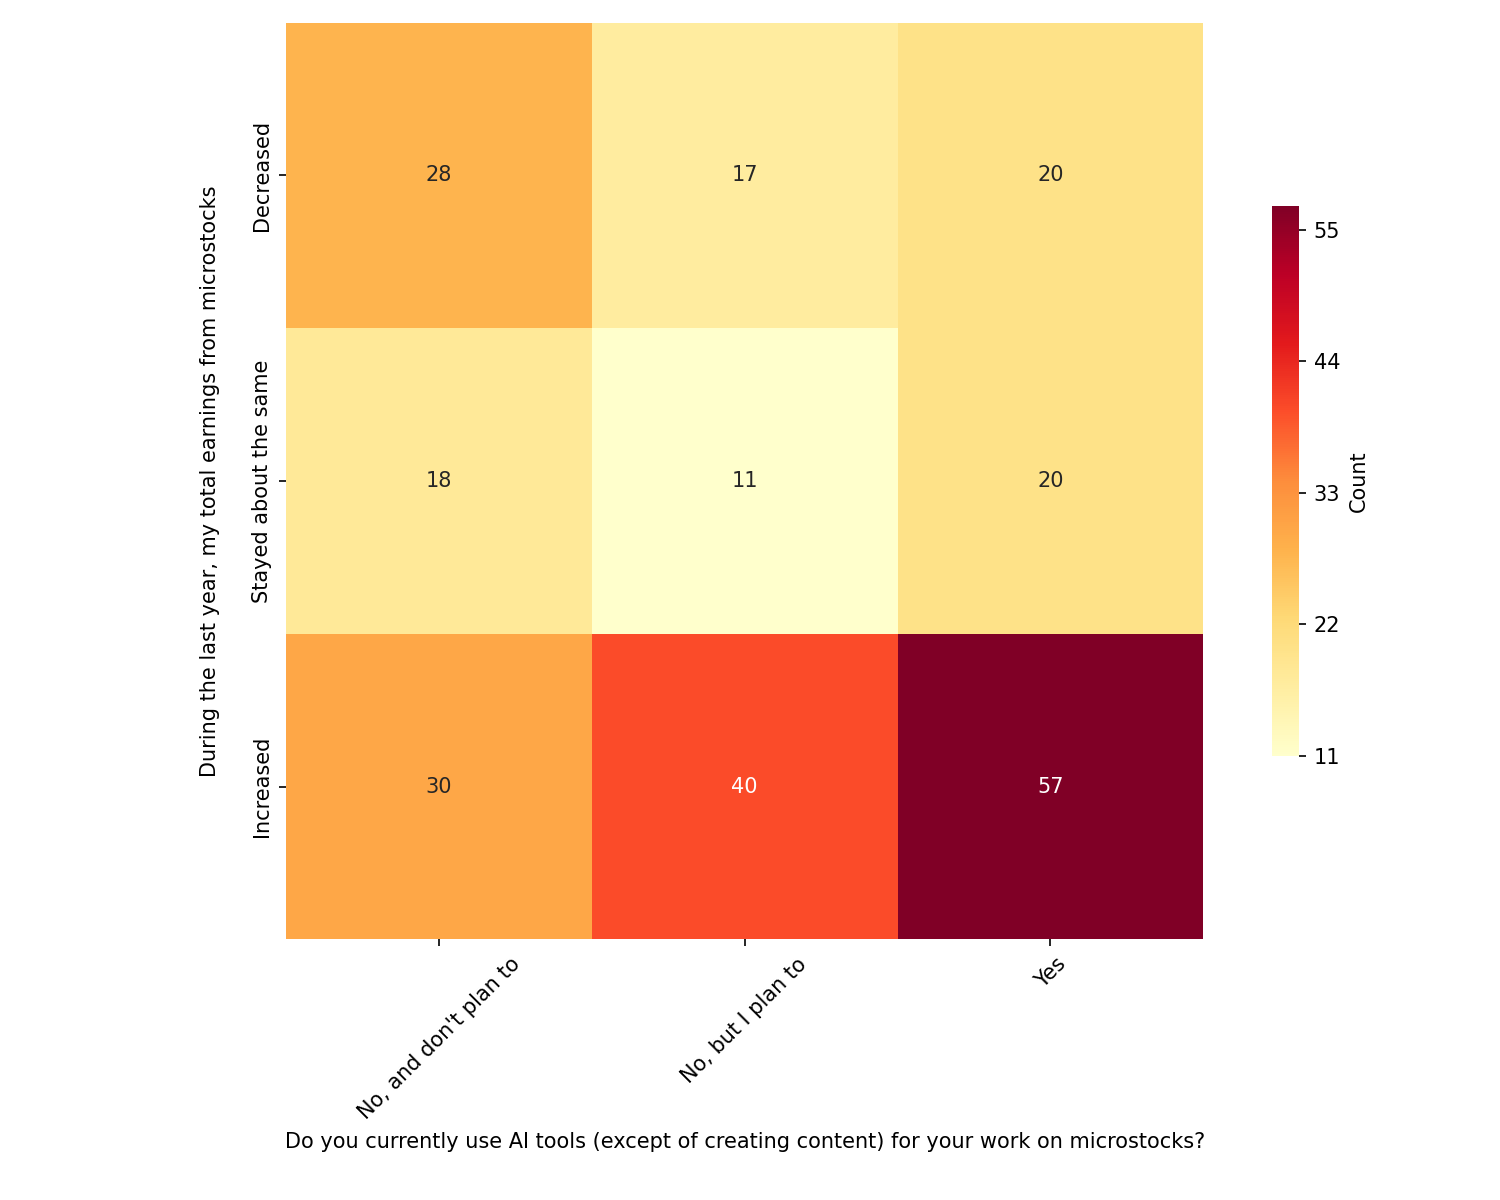
Again, as with the research impact, I offer to compare “Increased” versus “Same” plus “Decreased”
There’s an interesting distinction on this chart that, perhaps, touches deeper in human nature. Both people who use AI tools and who “don’t, but plan to” report their earnings increased (in a sense, there are more “increases” than “declines” plus the “same”). However, only people who do not use AI and don’t plan to, have “declines” plus “same” higher than “increases”. While I don’t know what is going on exactly, it might reflect some deeper distinction in the attitude, not relevant to “AI” in particular. For example, being less open-minded, not honing the craft or, in a sense, giving up on microstocks.
Selling AI-generated content
Contributors are selling AI content on microstocks, that’s a fact. However, it’s unclear if it provides bread and butter on their table.
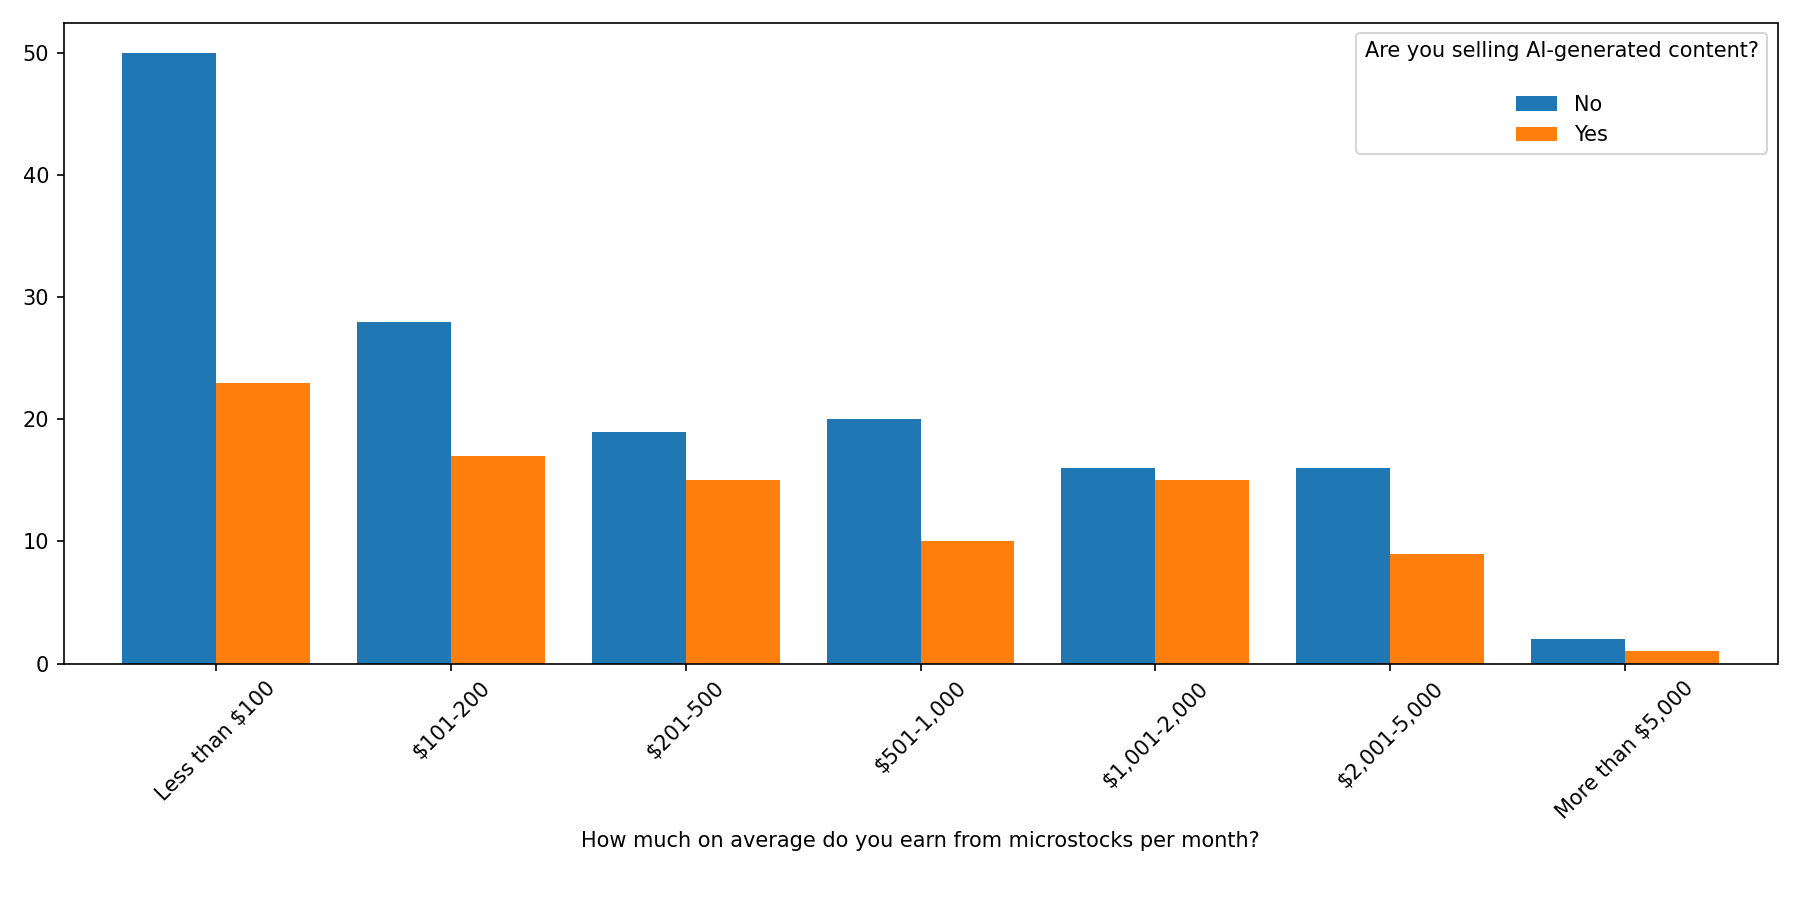
Contributors of all earnings tiers are actually selling AI-content, almost equally to those who do not, consistent with the previous chart. The only exception are lower-earning tiers that sell less of AI-content than their higher-earning peers.
Perhaps more experienced contributors are biased towards (or against) AI? We can find that out as well.
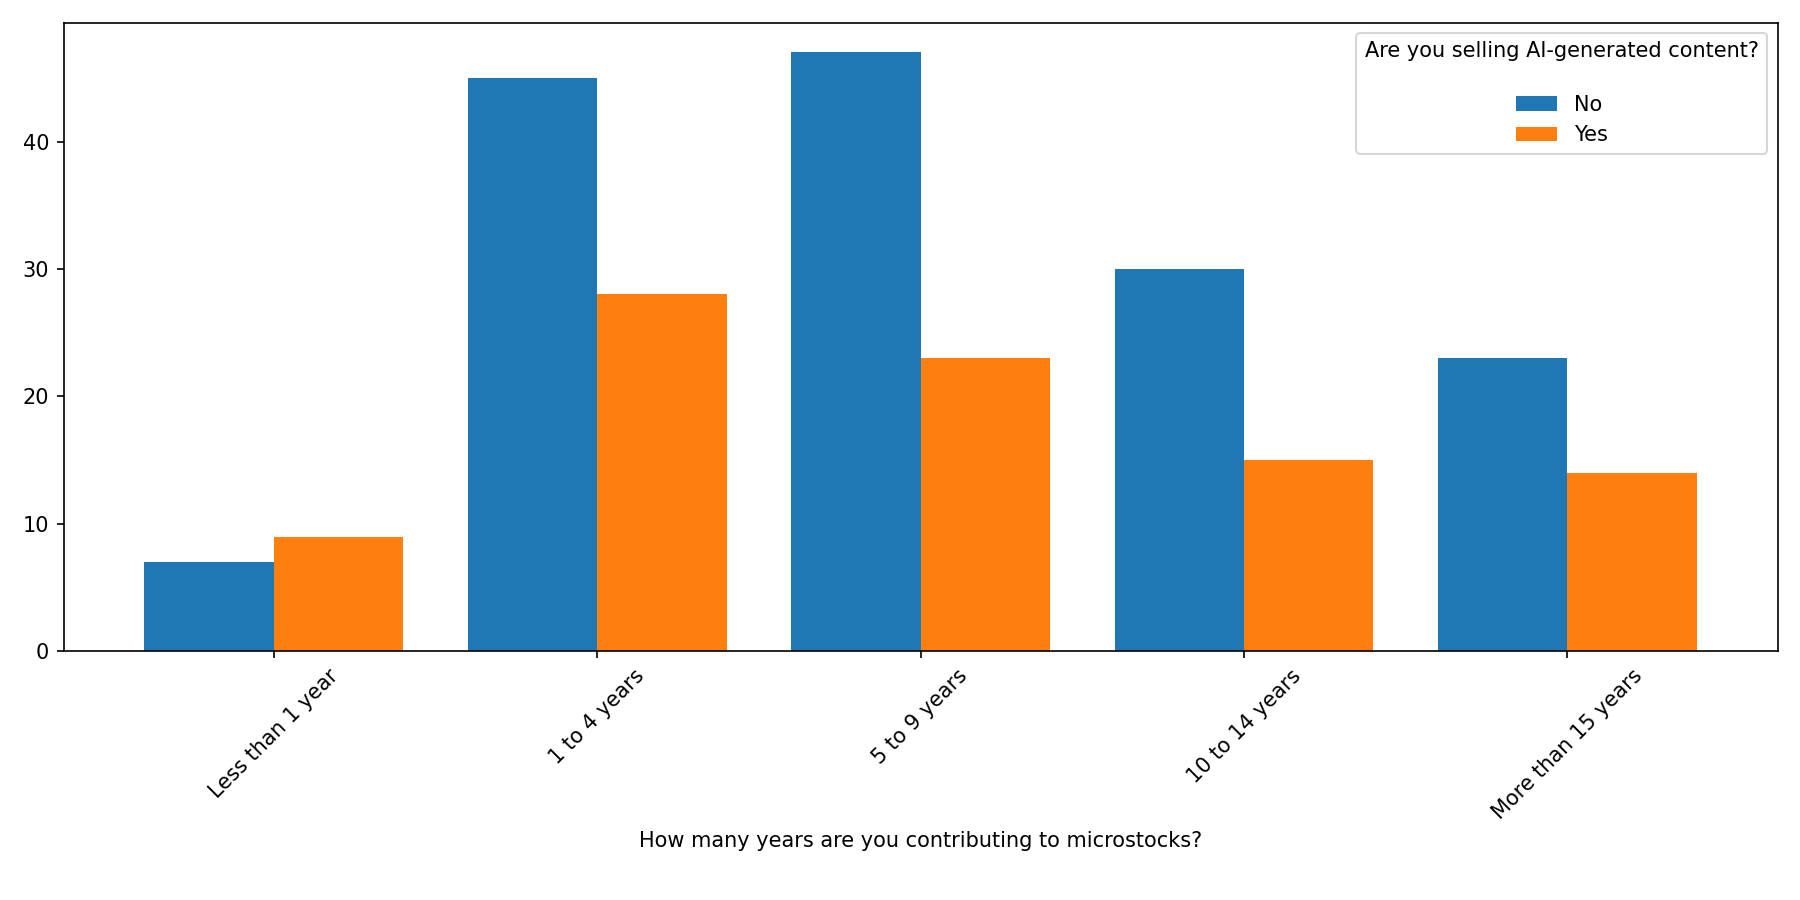
All groups, irrelevant to years of experience, do sell AI-generated content. The only group where there are more proponents are the “freshmen” group with less than 1 year of experience. Both 1-4 years and 5-9 year groups are more skeptical about AI, which decreases with experience.
Conclusion
This is the second and final part of the microstock survey 2024 analysis, where we covered everything related to content creation.
In case you missed it, check out Part 1 where all things related to earnings were covered. If you enjoy deep dives like this one, make sure to subscribe to our newsletter.


