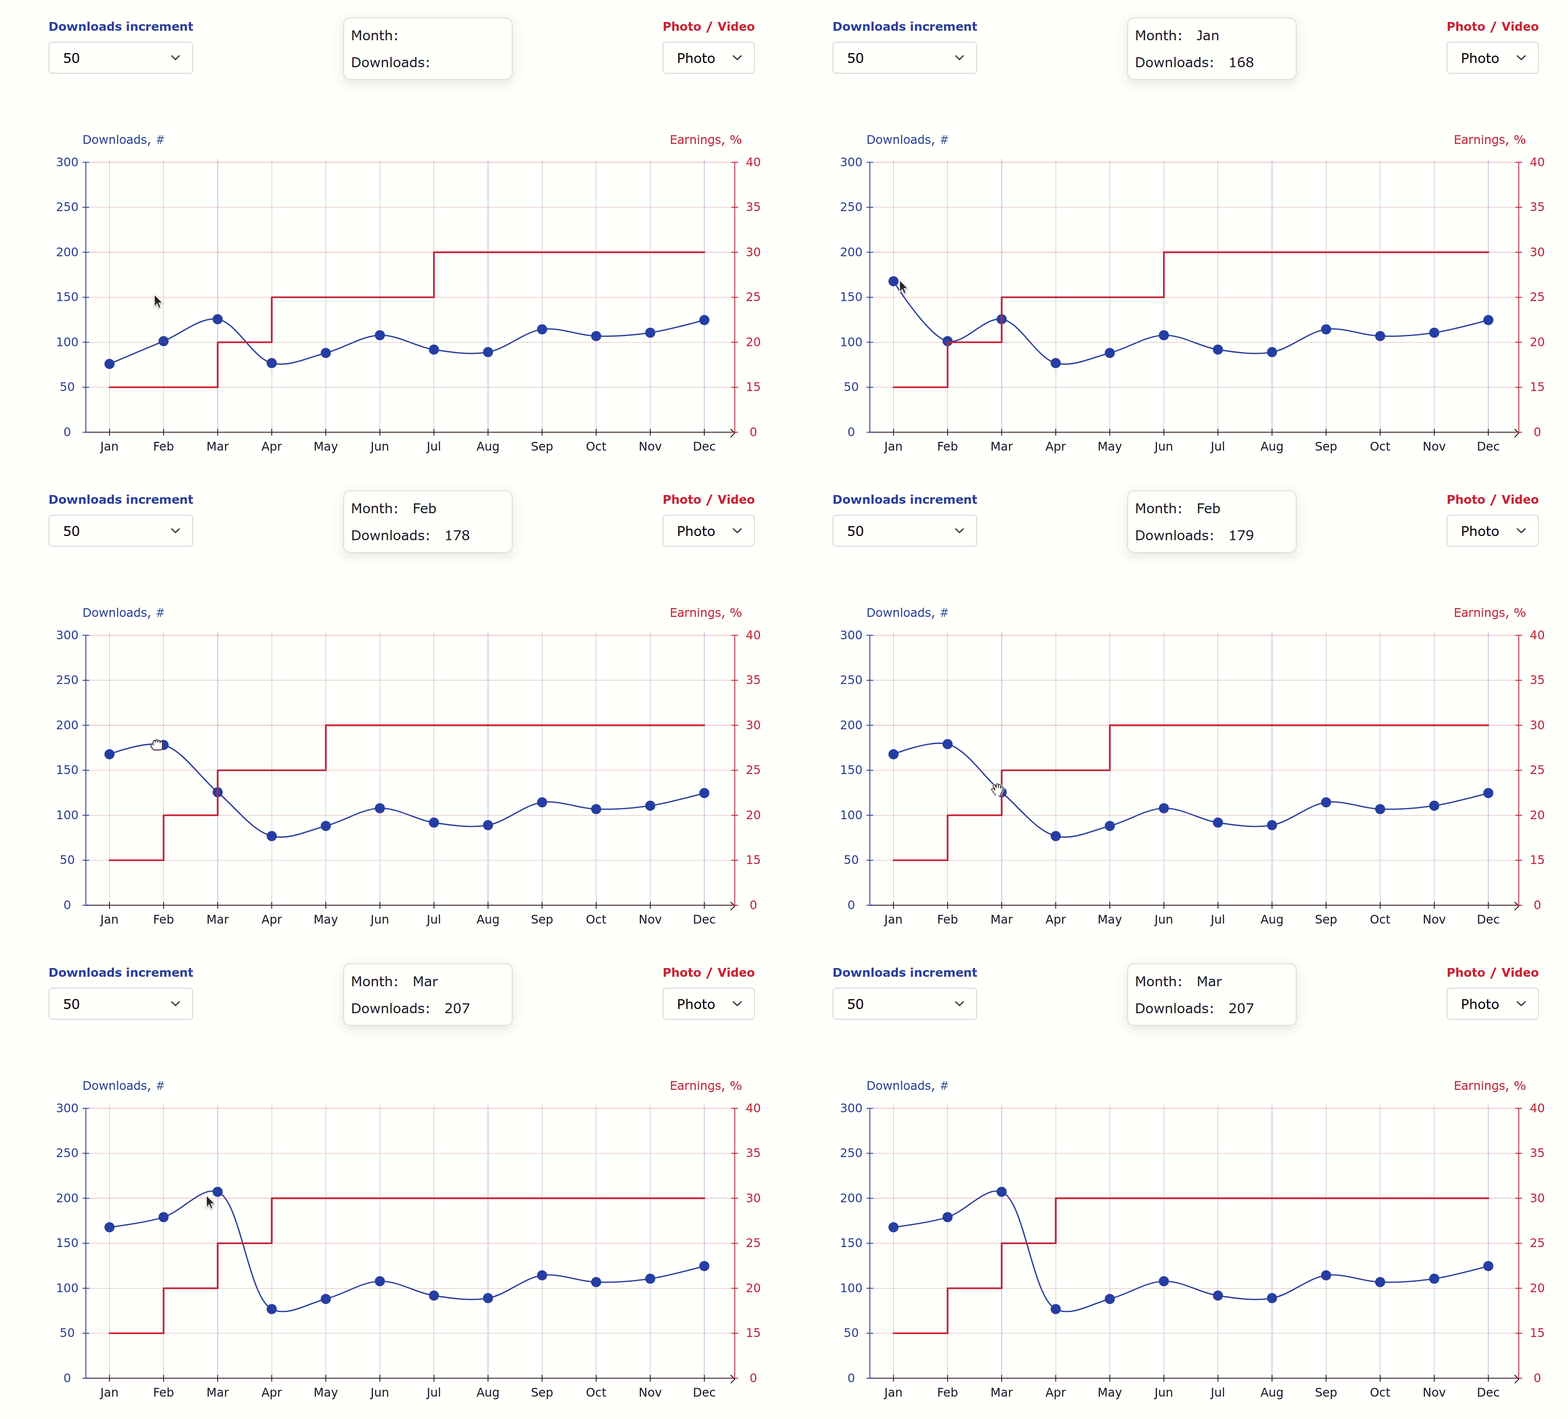
Even though many people’s earnings already decreased during the pandemic, Shutterstock just announced an update to contributor earnings levels effective June 1 2020. Obviously a company would not restructure earnings levels that it would earn less money so the question is only - how they will earn more. In this blogpost we run some simulation of contributor earnings per month and try to figure out loss in earnings for contributors.
It is hard to calculate exact new earnings in US dollars, but it is relatively easy to estimate your loss in percents based on a number of monthly downloads that you have. So just check how many downloads you have in Shutterstock Contributor Portal and check the charts below.
Old earnings breakdown
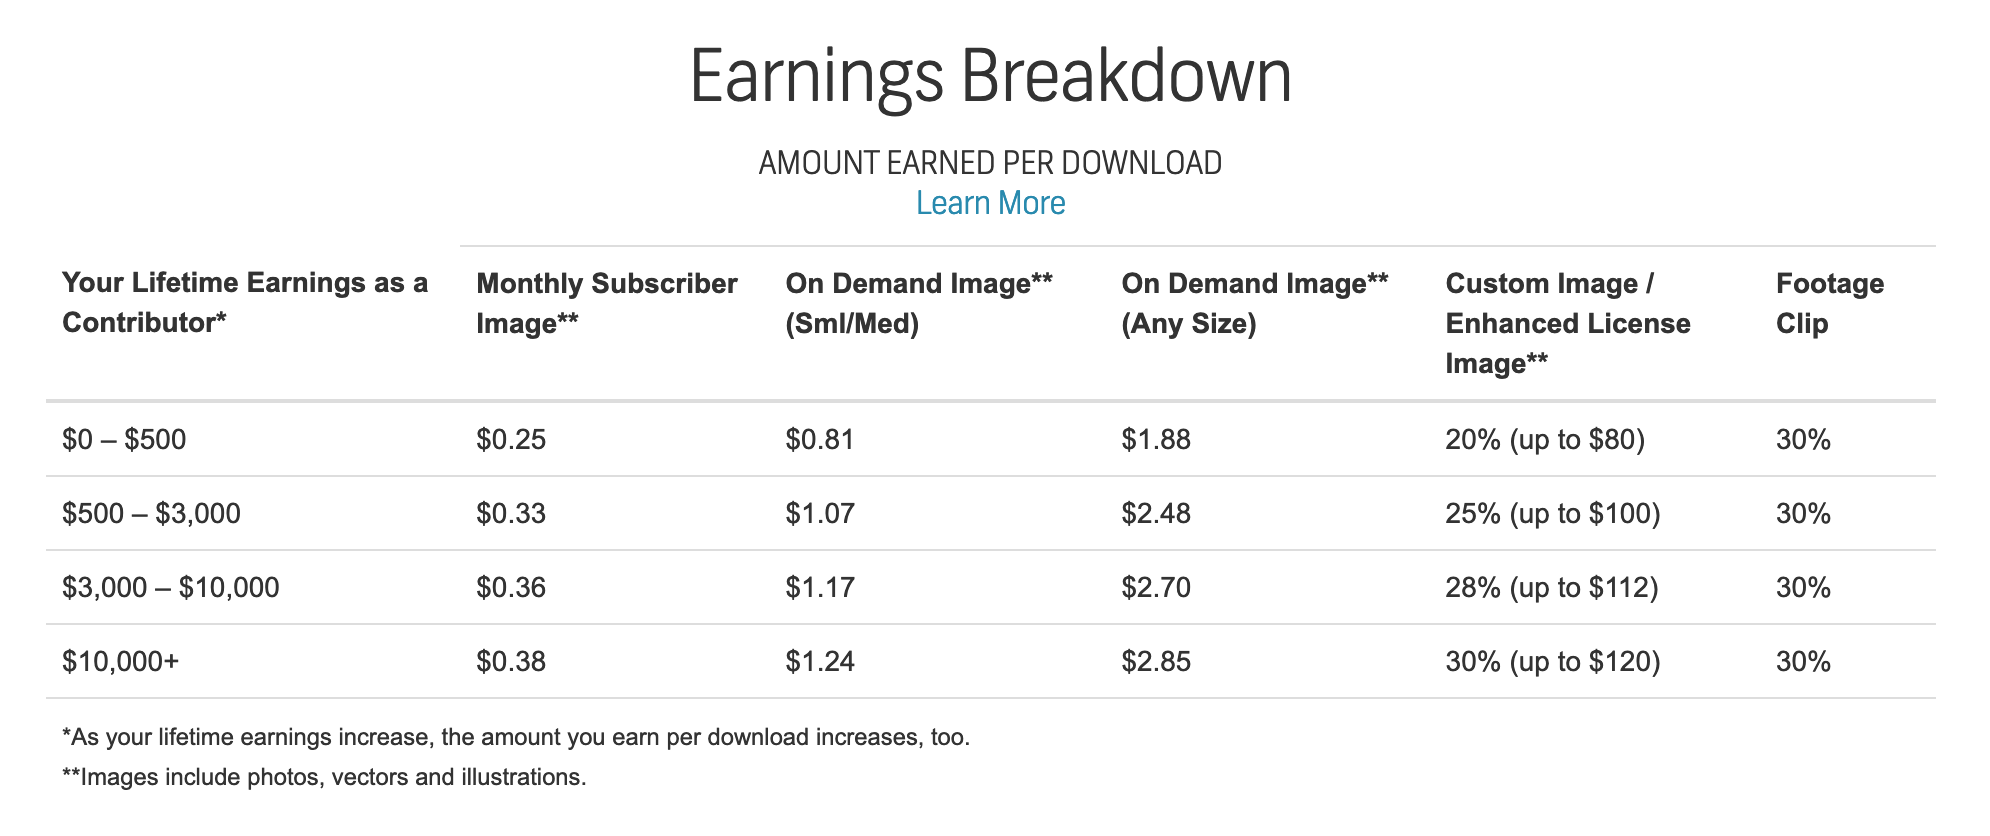
This is how Shutterstock earnings looked before the change
What can we get from this breakdown is that video earnings are flat rate 30% and maximum image earnings are also about 30%, even that for subscriptions you get a flat tiered price.
New earnings breakdown
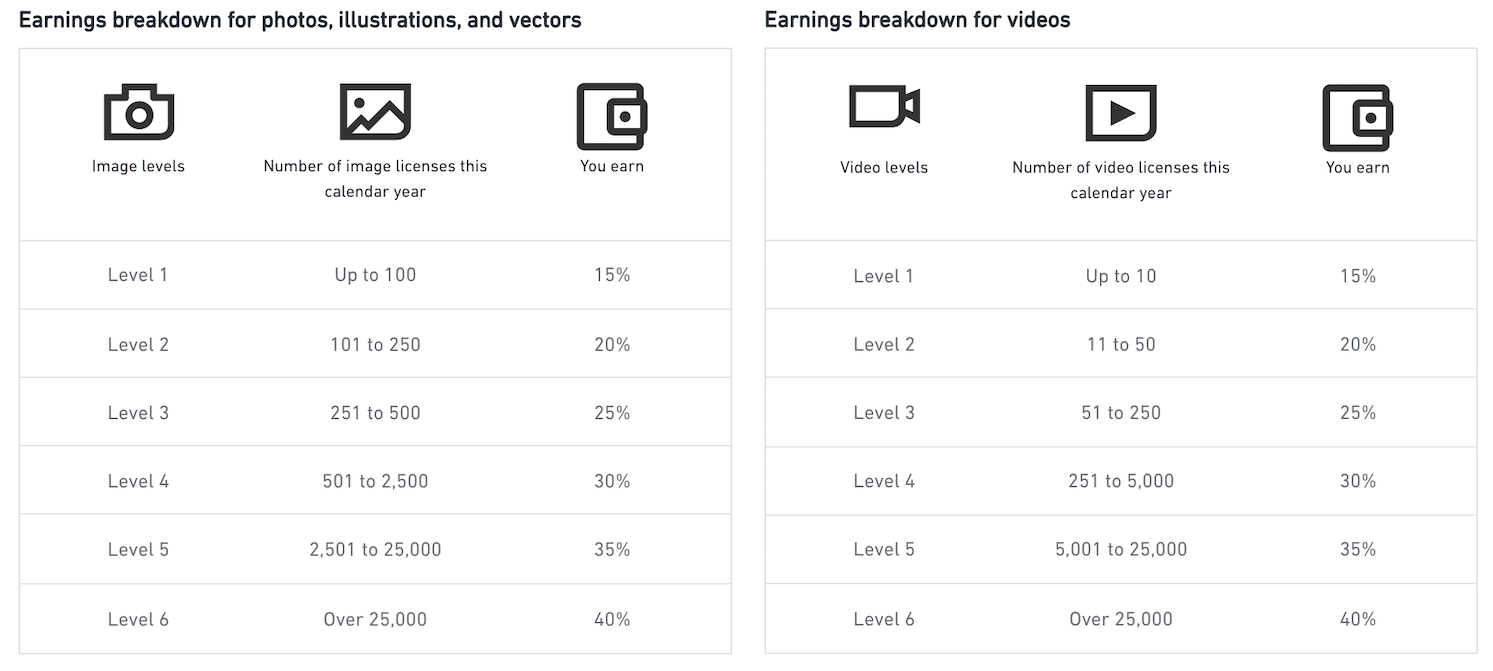
This is how it looks after the change
On itself probably it wouldn’t be so bad, but Shutterstock will reset your level every January 1st. That means that during the first months of every year you will earn less.
If you put those levels on a chart, you will get something like this:
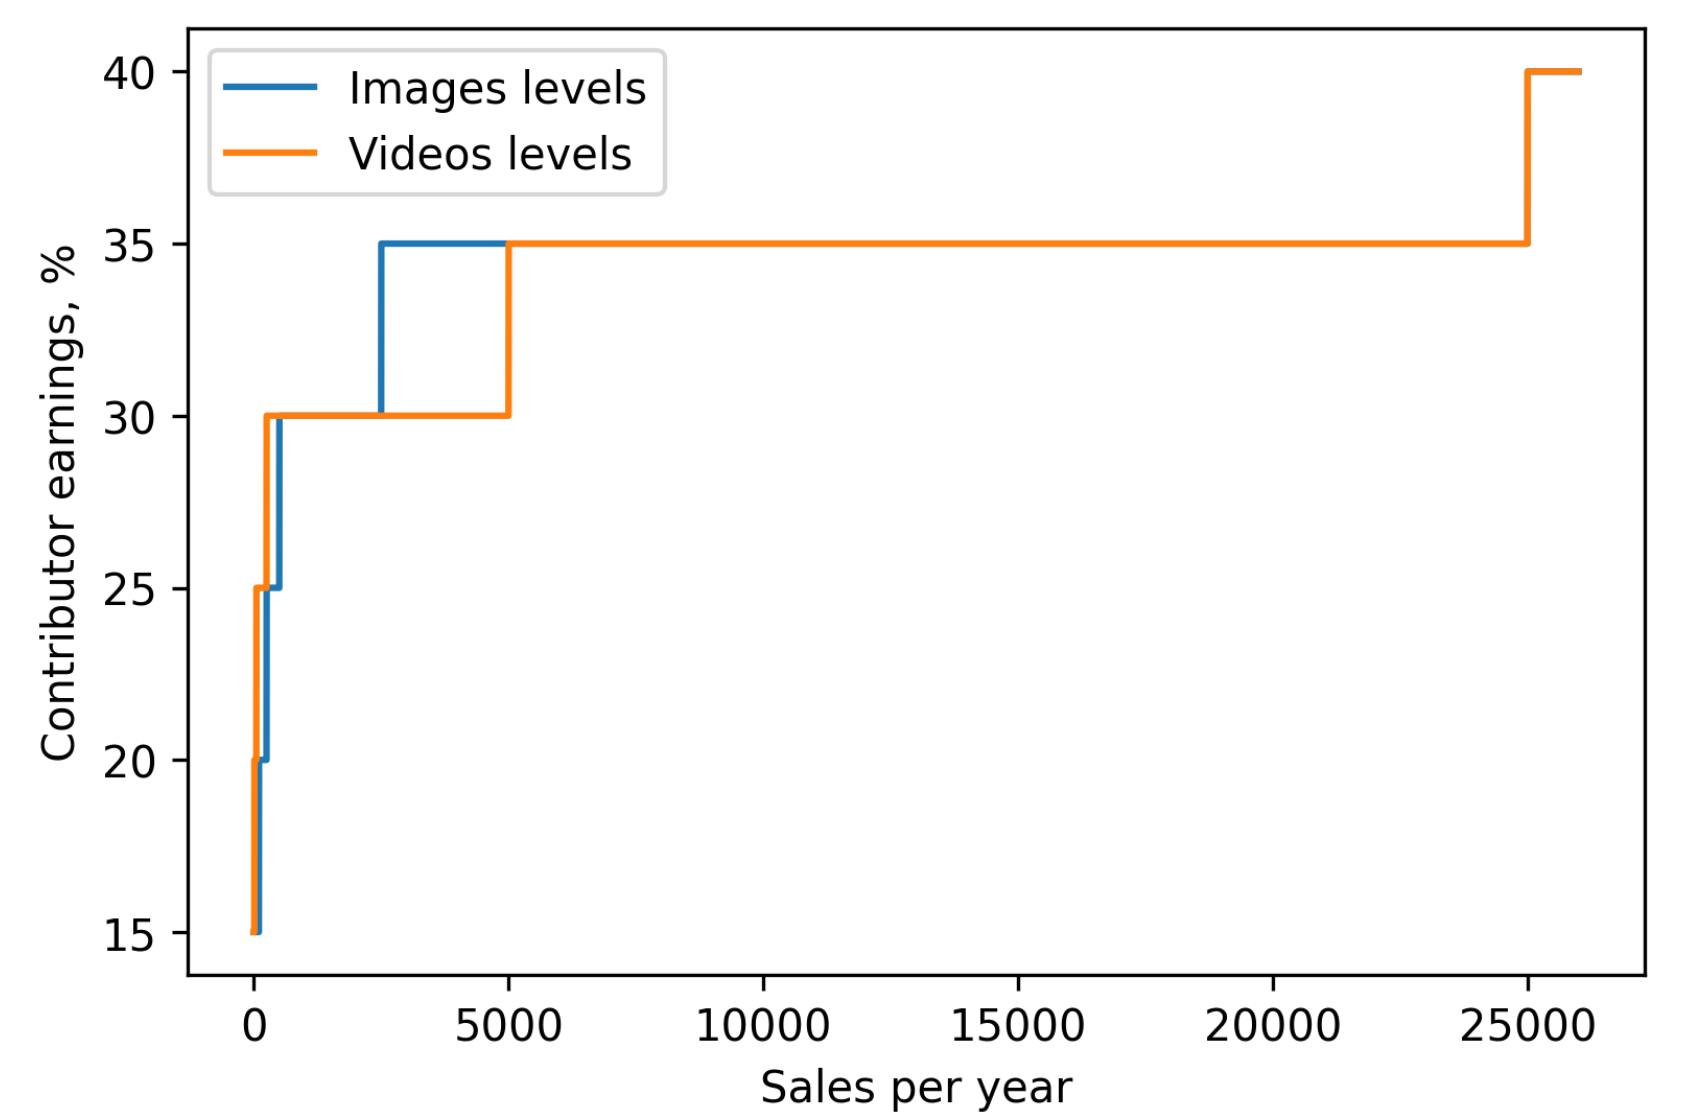
This is how new earnings breakdown looks visually
You can see that video levels grow faster when they are smaller, but image earnings reach 35% faster than videos.
Earnings calculator
If you’d like to play interactively to see what you level will be, you can do so using online calculator.
Effective earnings percentage per year
What can be interesting is to calculate what is your effective earnings percentage per year. To do that we simulated contributor earnings per month and put the resulting level on the chart.
Photo
Chart for photos:
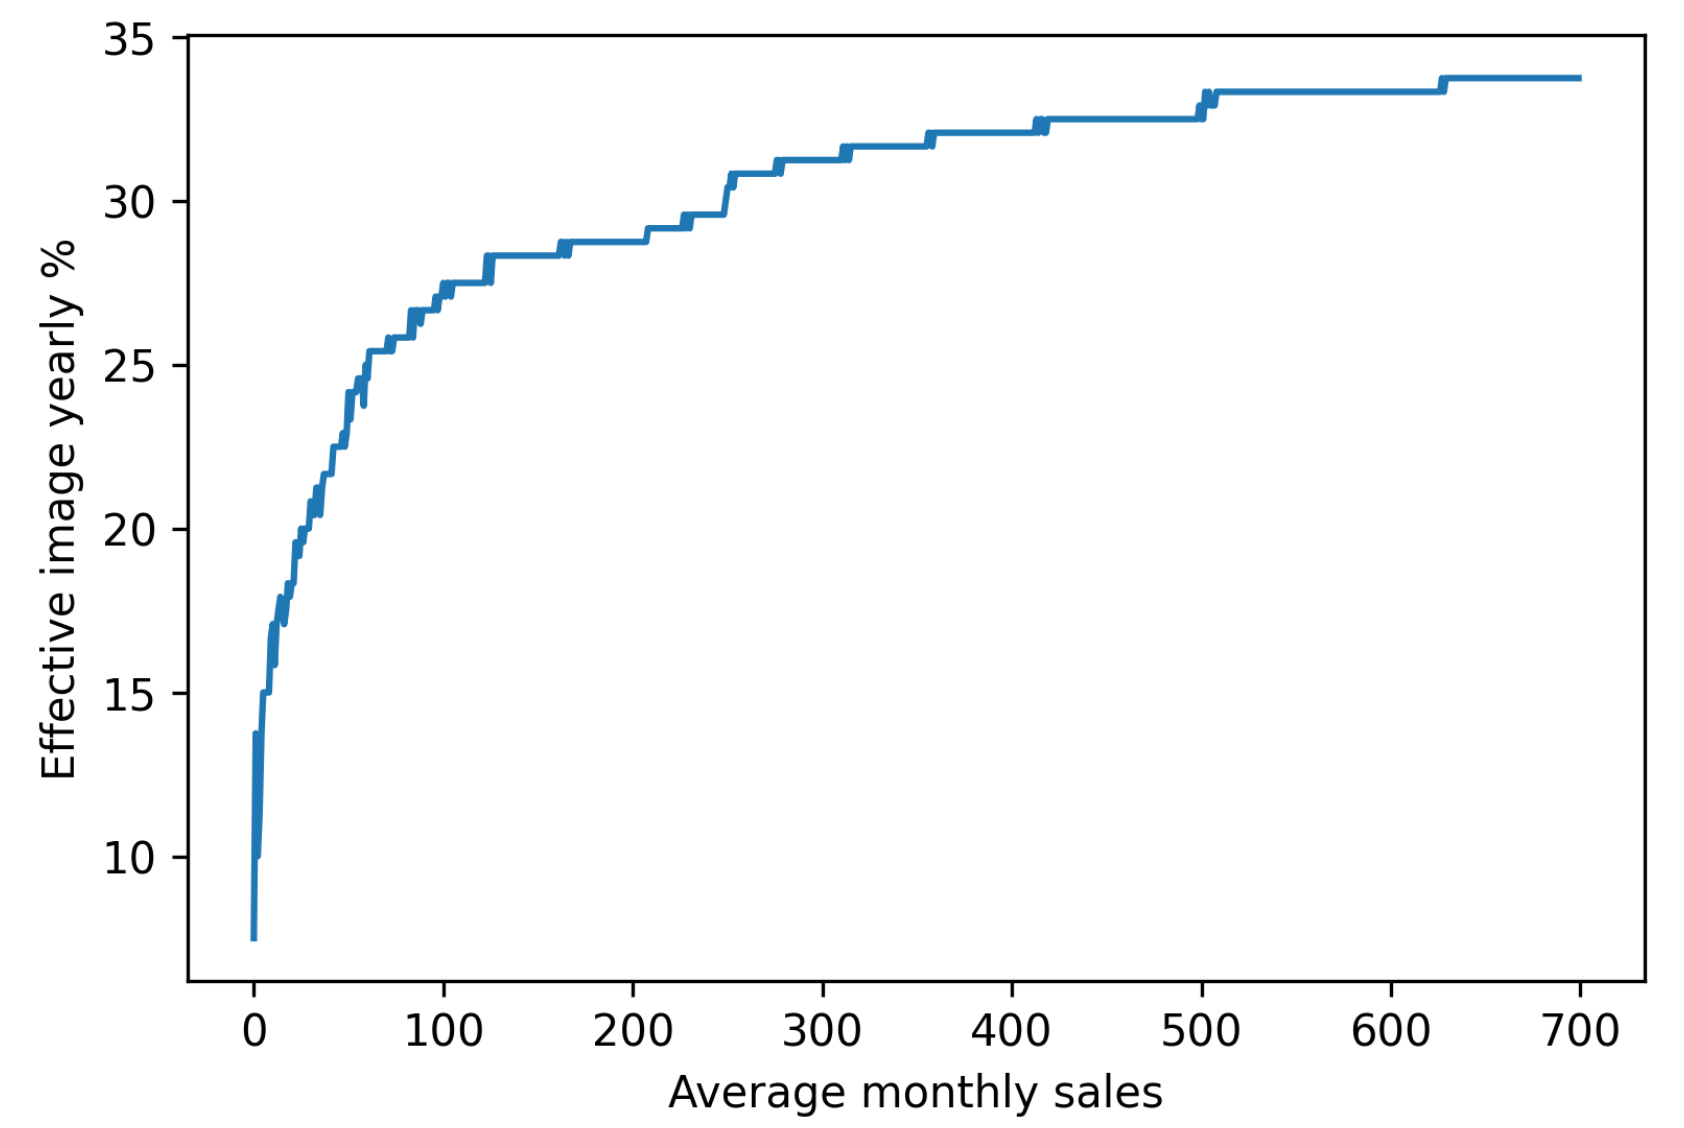
Averaged effective contributor image commission per calendar year
That means if you have on average 100 monthly sales for all 12 months, through the year you will earn effective 25% commission per download on average. If you have 200 monthly sales, you will get around 27% per download and so on. This is just another way of looking at the percentage breakdown.
Video
The same chart for videos:
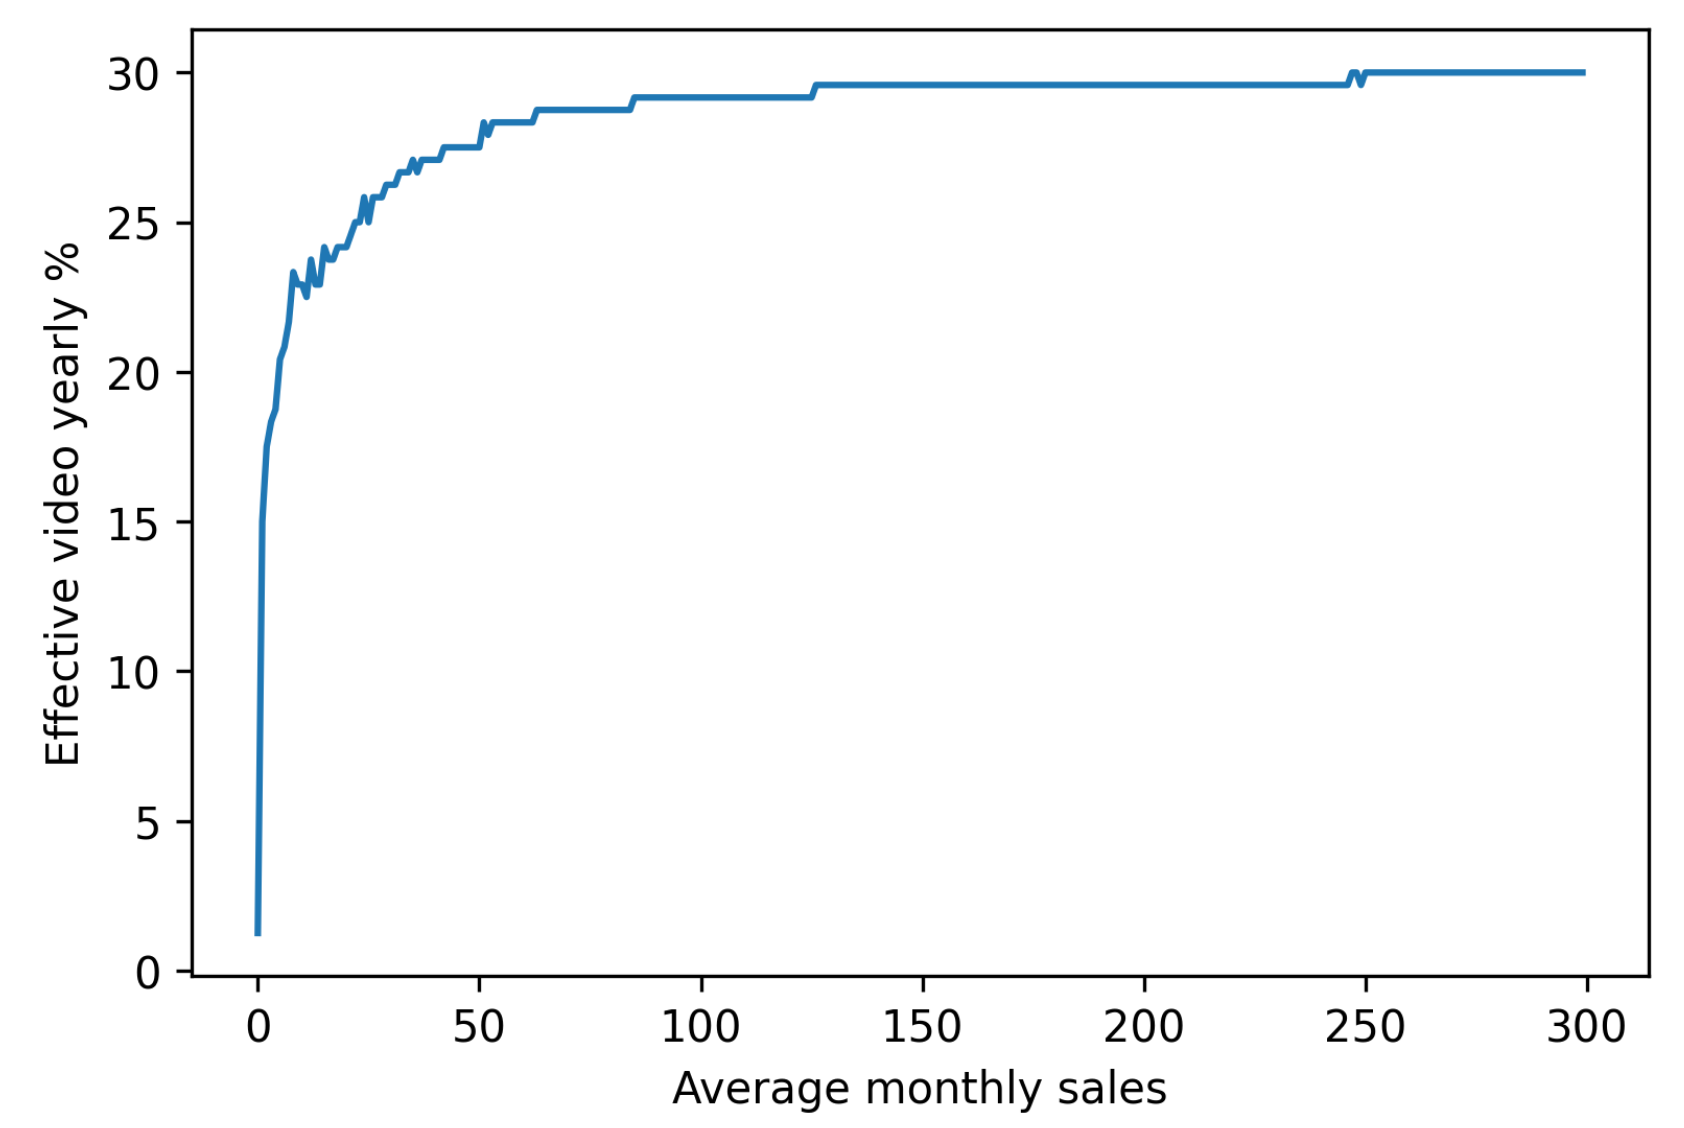
Averaged effective contributor video commission per calendar year
Same conclusion as per breakdown: effective video commission grows faster in the beginning but stays flat for longer later.
Earnings progress through the year
Let’s see how fast your earnings level grows given your monthly downloads number.
Photo
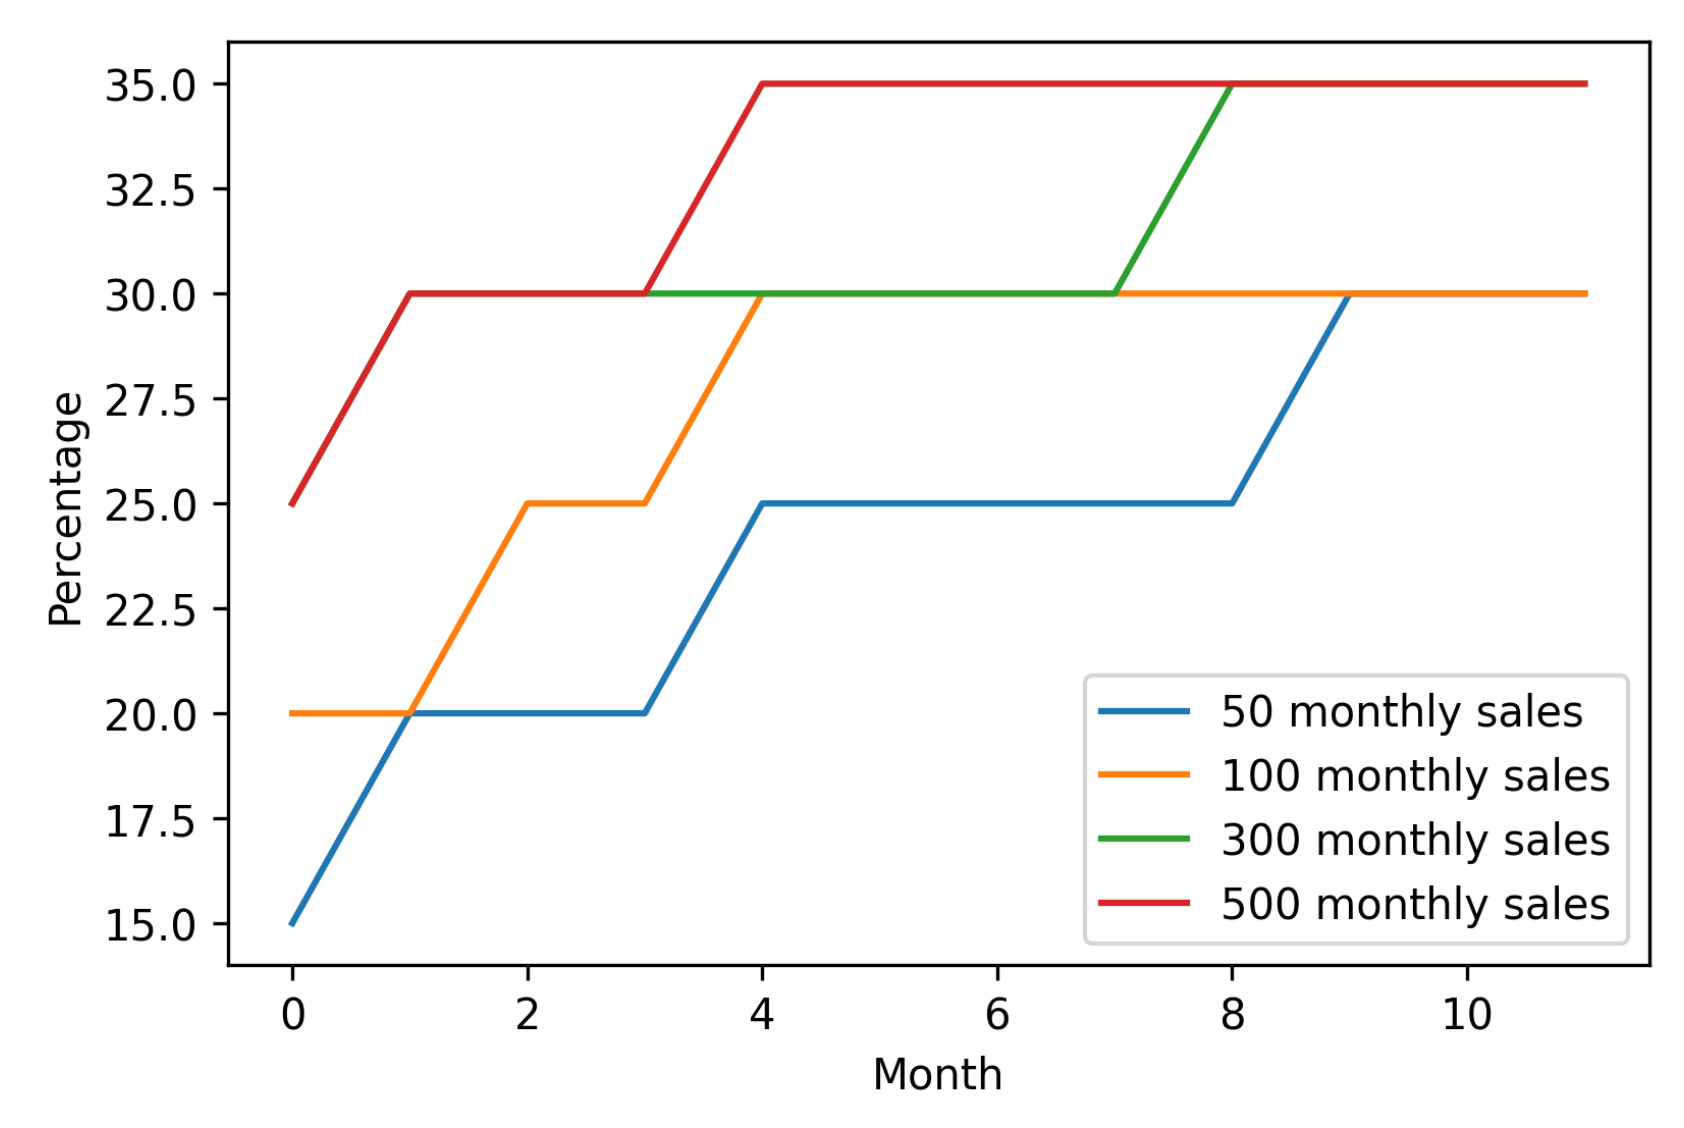
This is how your level changes through the year based on monthly downloads
If you have 50 monthly downloads on average, it will take you a whole year to get to 30% commission. On the contrary, if you have 300 monthly sales, you will reach 30% already in March.
Video
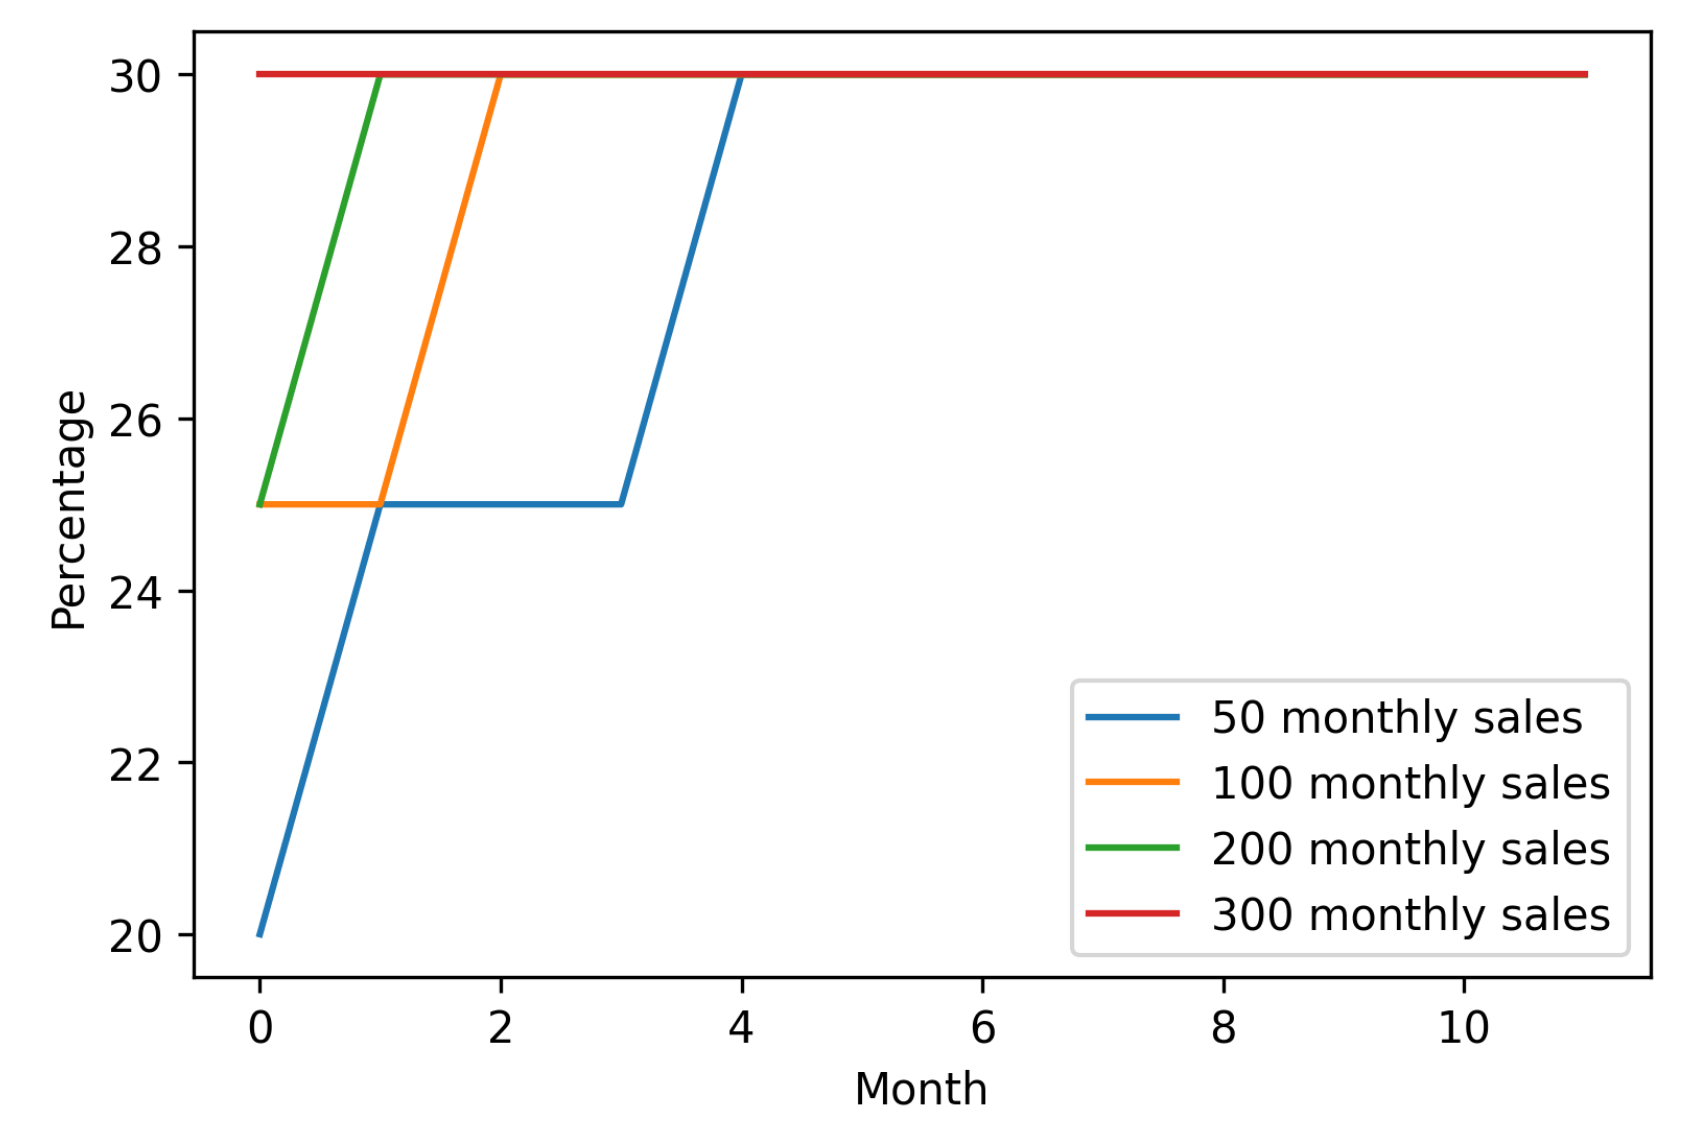
This is how your level changes through the year based on monthly downloads
For video the story is a bit different as you will reach 30% (current video flat rate) already in February given that you have 100 monthly downloads.
Earnings loss
Video
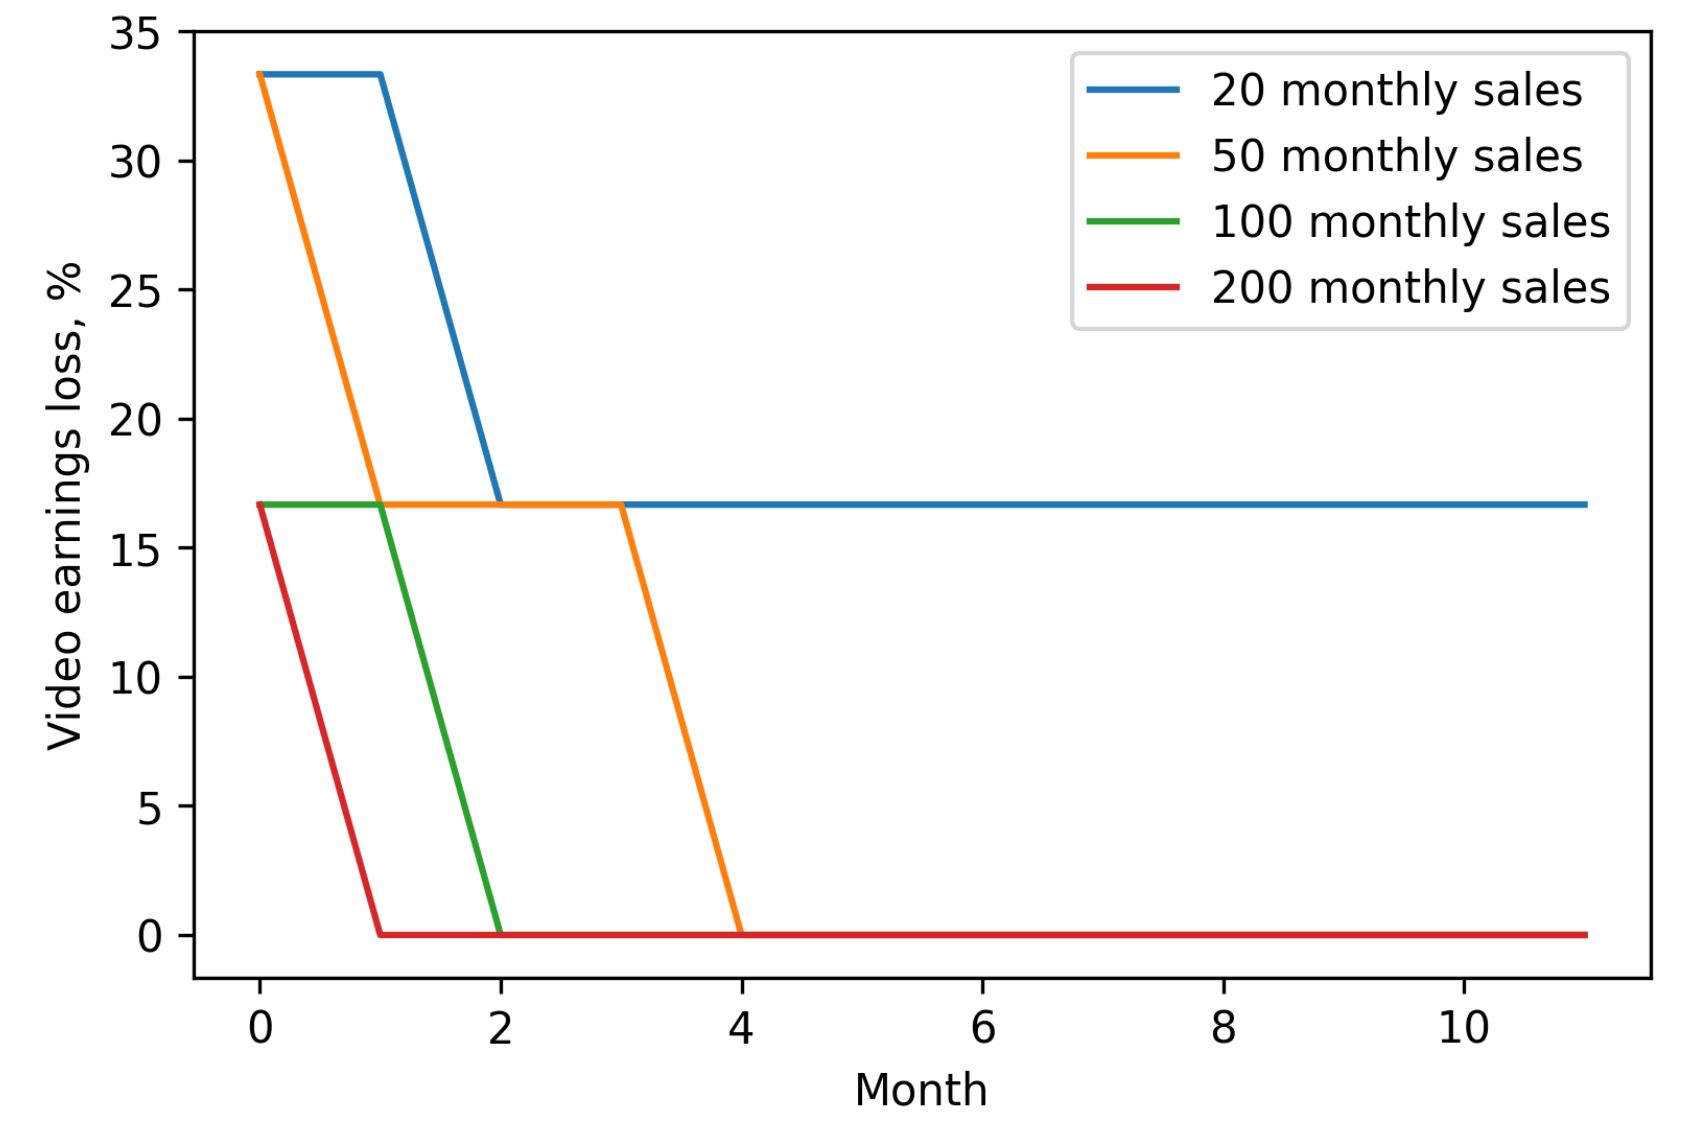
While earnings progress through the year is only for illustration, but it can show us the loss you will take. For that we need to turn the chart bottom-up. Since we know current video earnings level (flat rate 30%), we can calculate how much money you will loose comparatively to that based on number of your monthly downloads.
Earnings loss on video through the year
So if you have 50 monthly video downloads on average, previously you would earn 30% royalty and now you will earn only 20%. That means that during the first month you loose around 35% of your previous earnings. During the next three month - you will loose around 16%.
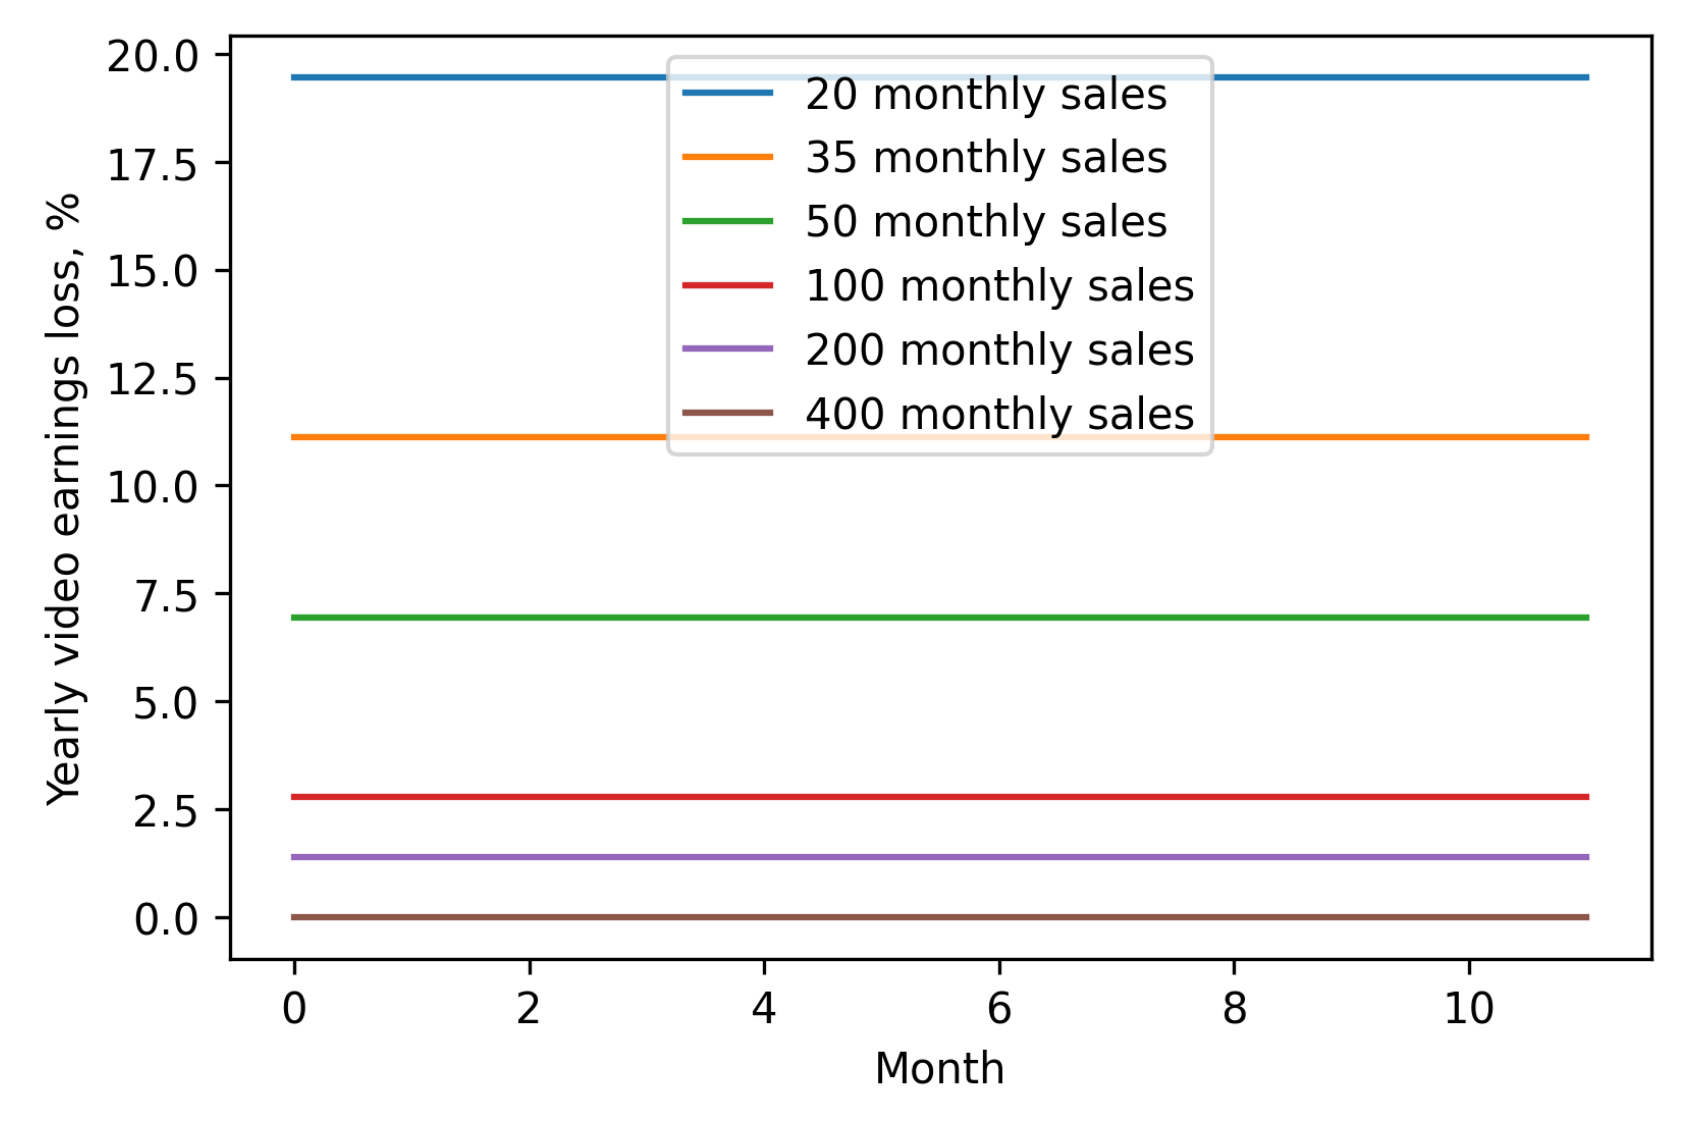
Based on this data we can calculate how much money you will loose during the whole year. For 50 monthly downloads if you lost 35% during the first month and 16% during the next three months, your total loss for the year is around 7% of earnings (you need add losses up and divide by 12).
Total video earnings loss for the whole year
Which means that if you have 50 monthly video sales, during the whole year you will earn 7% less money than with old Shutterstock earnings breakdown. However, if you have 400 video sales per month and more, there will be no difference for you.
Photo
It is much more complex to calculate earnings loss for photos because Shutterstock does not publish how much do they pay contributors in percents. However, given the old earnings table, you can see that maximum earnings per image was 30% for Custom/Enhanced and we can take that as a baseline.
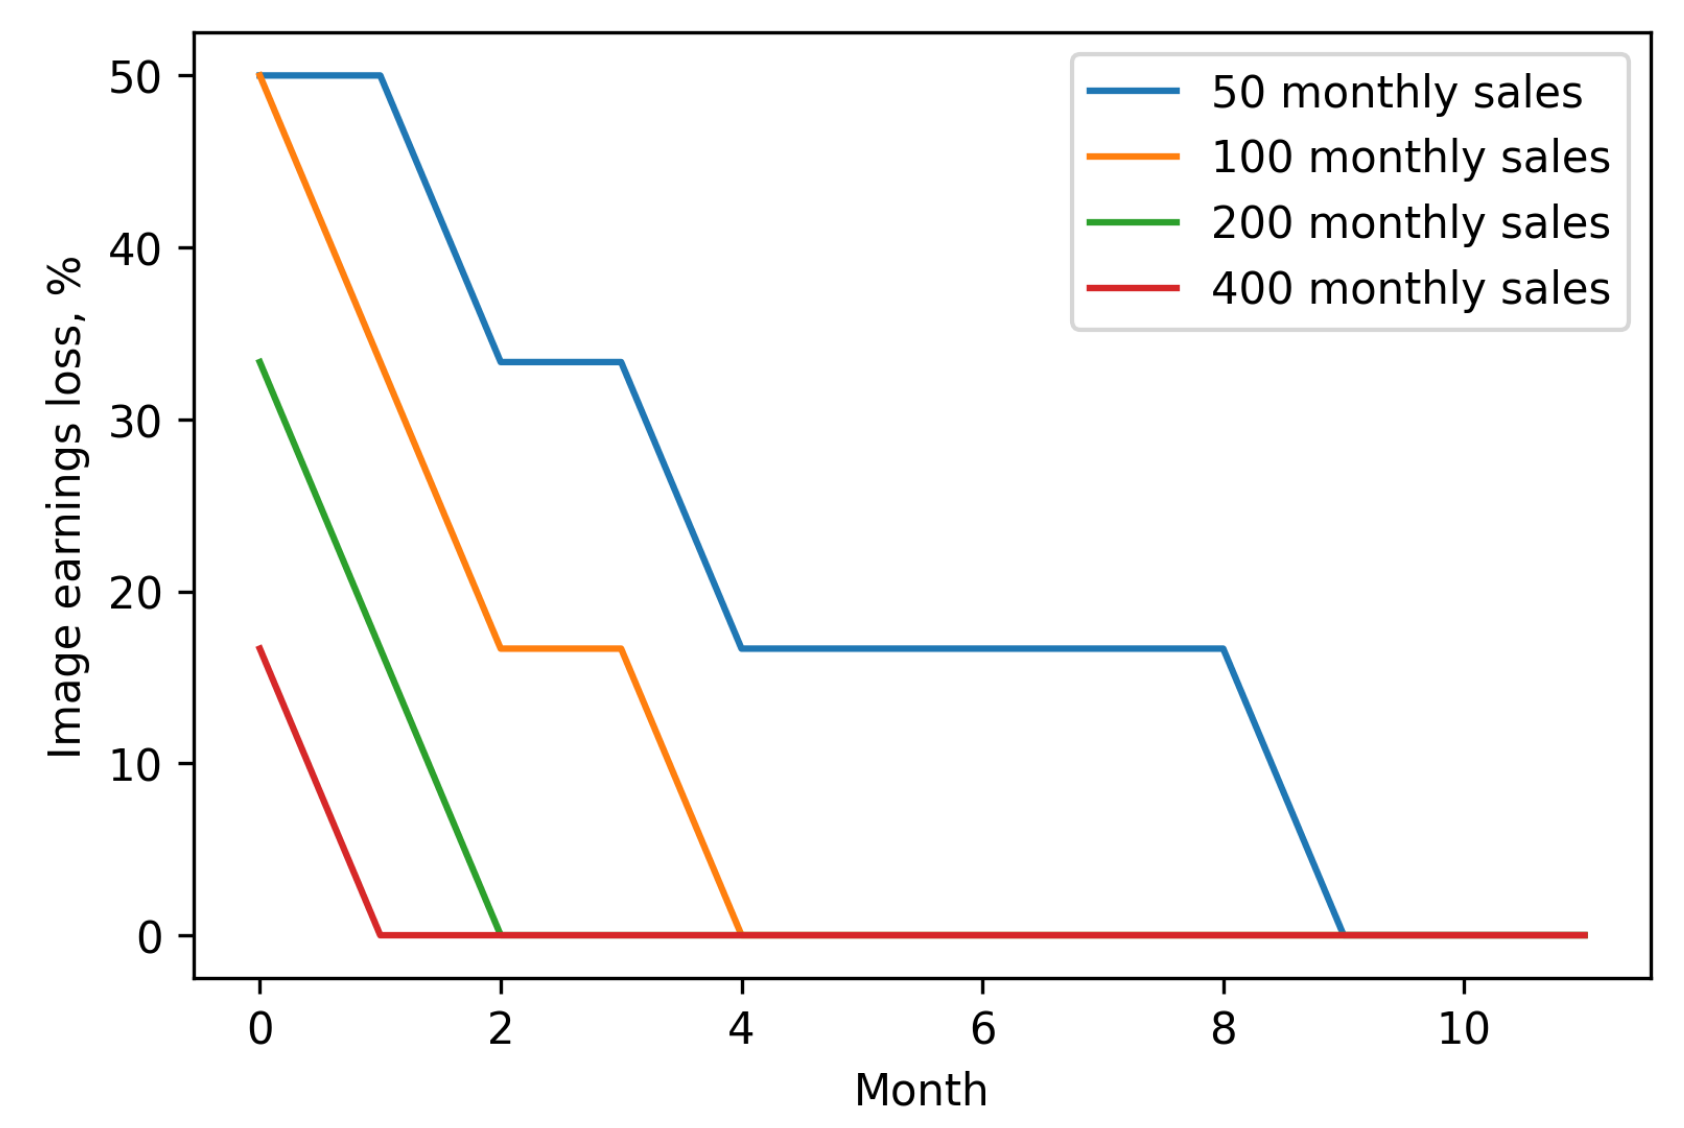
So now let’s calculate potential earning loss if you earned 30% royalty for image downloads.
Earnings loss on photos through the year
This shows us that in the beginning you will loose as much as 50% of your earnings in case you have 100 and less downloads per month. Even if you have 400 downloads per month, you will loose around 17% during the first month.
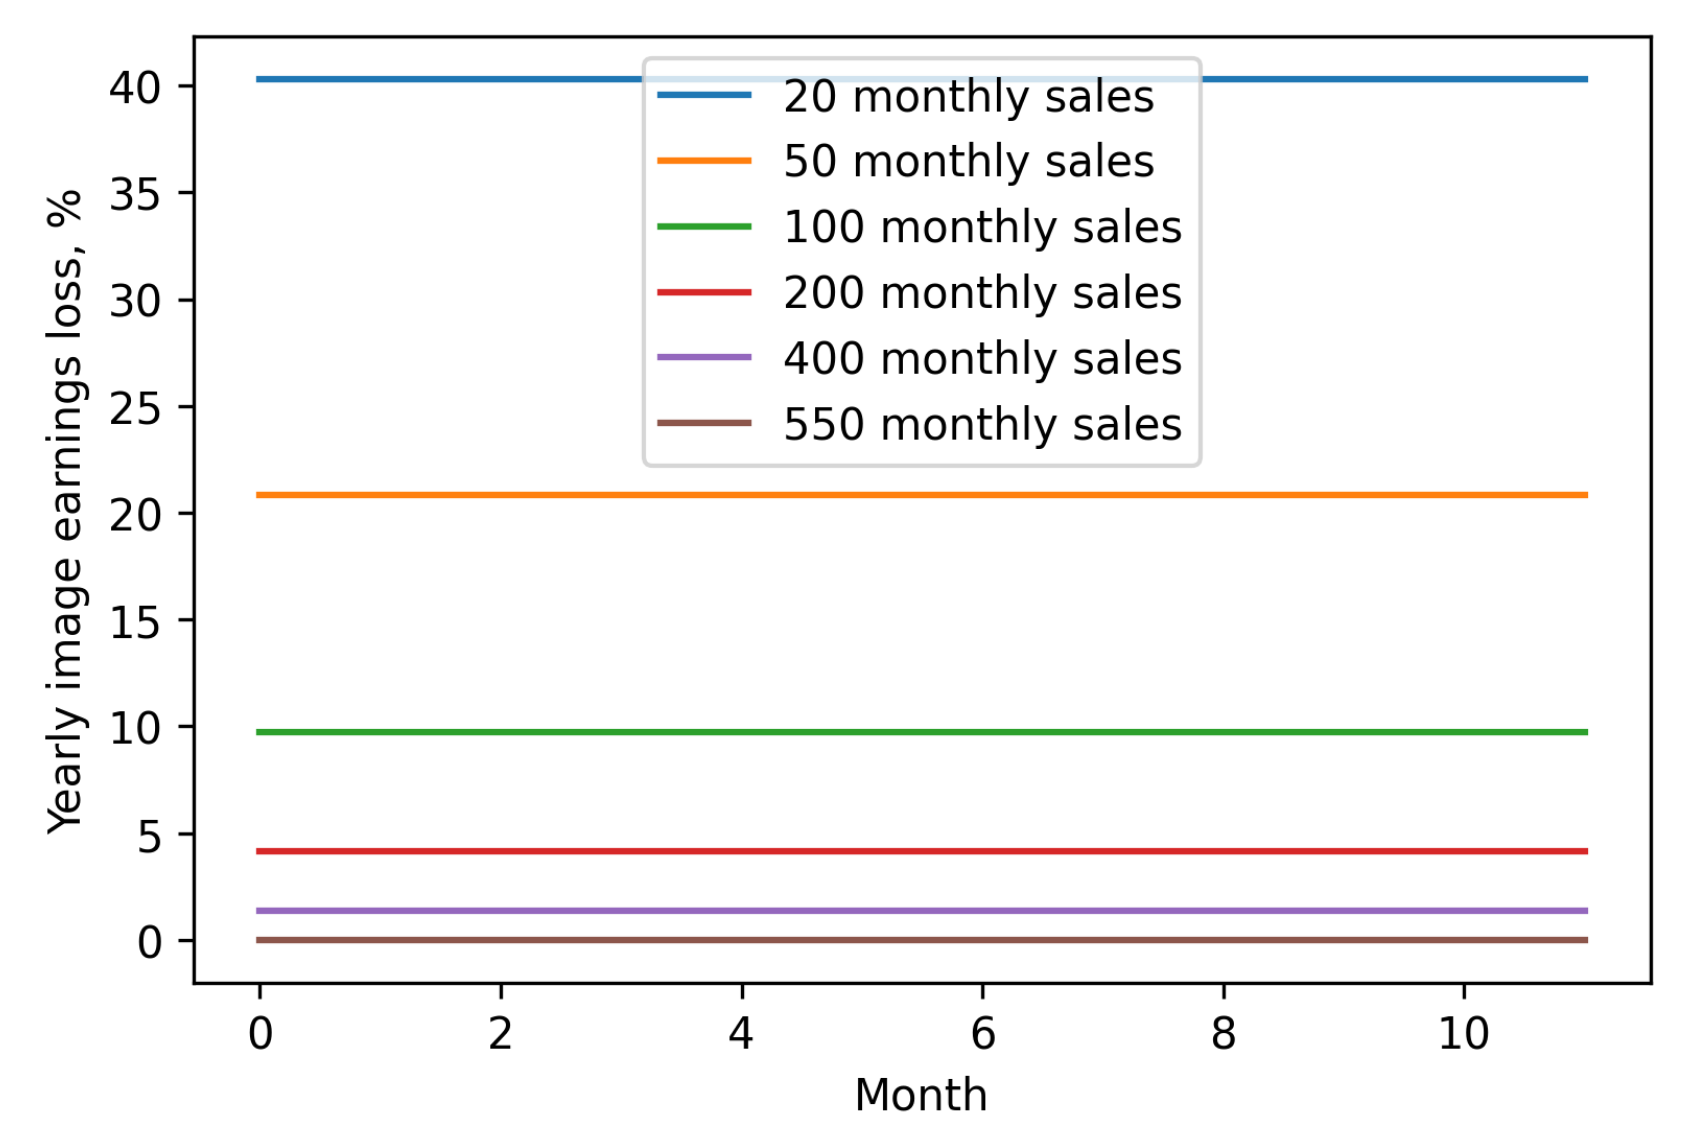
Now let’s see how much you may loose for the whole year if you earned 30% royalty for images.
Total image earnings loss for the whole year
What this chart can tell you is that you need to get 550 downloads per month to keep current level of earnings on Shutterstock. If you have 200 downloads per month, your earnings will decrease around 4% and if you have only 50 per month, you will start receiving 50% less money.
Conclusion
Hopefully this analytics gives you some insights into how your earnings will change with the new rules. If you are interested in verifying the charts provided in this blogpost, you can get Jupyter notebook here and run your own calculations.
Currently Shutterstock Forum is flooded with people’s anger and hatred. It is clear that Shutterstock anticipated such reaction and they calculated that even given contributor churn, they still will win in this situation financially. Some contributors started collecting signatures in a petition, but we’re not sure it will change anything.
You can get more information about Shutterstock here.
Update for June 2020
It is exactly a month after Shutterstock changed earnings structure in May.
Since then contributors:
- posted 6500 complaining comments in the Shutterstock forum thread (with some being deleted by moderators)
- created a coalition
- signed a petition (and even one more petition)
- decided to deactivate their portfolios for a week starting at June 15 (and then a little bit more)
- started seeking a legal action
It is a very unfortunate of course, but most probably “resistance is futile”. This was a bold decision and Shutterstock Inc. did their calculations. Furious contributors reaction and churn was anticipated. This is clear from the way how Shutterstock threw this update 5 days before the actual change and from their silence on forums where they announced the change.
Subscriptions
In general contributors reported decline in subscription earnings. Majority were downgraded to lower levels where they make $0.1 per image and people with huge portfolios - to $0.21-0.25 per image.
Examples of grand total earnings on subscriptions:
| May | June | Loss, % |
|---|---|---|
| 15.84 | 5.11 | 67% |
| 10.25 | 2.36 | 76% |
| 131.10 | 75.78 | 42% |
Examples of reported average earnings on subscriptions:
| May | June | Loss, % |
|---|---|---|
| 0.36 | 0.18 | 50% |
| 0.38 | 0.19 | 50% |
| 0.25 | 0.21 | 16% |
| 0.38 | 0.25 | 35% |
| 0.38 | 0.23 | 40% |
For subscriptions everything is clear and is exactly as calculated in Xpiks blog before.
On-Demand Downloads
With ODDs situation is a little bit tricky because they were fixed price products before and now they are percentage based. Some contributors reported earnings increase here.
Examples of grand total earnings on ODDs:
| May | June | Loss, % |
|---|---|---|
| 8.10 | 12.68 | -56% |
| 22.80 | 23.19 | -1.7% |
| 57 | 39.98 | 30% |
Examples of average earnings on ODDs:
| May | June | Loss, % |
|---|---|---|
| 2.70 | 2.56 | 5% |
| 1.88 | 1.37 | 27% |
| 2.85 | 2.92 | -2.6% |
| 2.85 | 3.19 | -12% |
As you can see, even though sample for these numbers is absolutely random and not representative, there are still some reports of increased earnings in this category.
Single and Enhanced License
Single and Enhanced downloads usually are so scarce and rather random that we decided not to include their numbers since they cannot show anything useful.


