If you’ve ever wondered where to focus your creative energies, you’re in the right place. In this blogpost we are going to take a second deep dive into Steve Heap’s earnings. This time to see how much income was generated per category since 2007 and the dynamics of it. Additionally we will answer some existential questions, like is it better to work on nature pictures or conceptual ones.
About this study
Steve Heap from Backyard Silver has kindly provided his extensive data that we have already once explored to find the portfolio half-life in this blogpost. We’re looking at a portfolio with about 15,000 assets that is sold on about 15 agencies such as Shutterstock and Adobe Stock. Previous time we sliced data per agency, trying to find interesting patterns. This time we are going to focus on topics of the content that he is producing and selling.
Note that data has a cutoff point in early 2023, but the trend analysis still shows a lot of insights.
Another important note is that we are not estimating best categories by ROI (Return Of Investment), taking into account cost/effort to produce, but by the total earnings.
Shutterstock vs Adobe Stock
We will take a closer look at two of the most popular agencies today: Shutterstock and Adobe Stock. Accordingly to few polls, these are the top-yielding agencies for many contributors.
If we will compare Steve’s earnings yielded by these two agencies, we’ll see that although Shutterstock has been doing great, Adobe Stock was rising with a great pace:

Note: Adobe acquired Fotolia in 2015 and rebranded as “Adobe Stock”
For the rest of the study, we will compare trends between those two.
Shutterstock earnings
Let’s pull the Shutterstock earnings only and split them per category they are in. For this purpose we will analyze all images in Steve’s Portfolio and fetch their category.
Note that Shutterstock allows 2 categories to be specified per image and we scale the earning amount where needed to reflect that.
Portfolio composition
Let’s take a bird’s eye look at the portfolio in total. We will take only images that were sold at least once and group them by category. On Shutterstock Steve has a bit more than 10,000 images that were sold at least once out of 15,000 total.
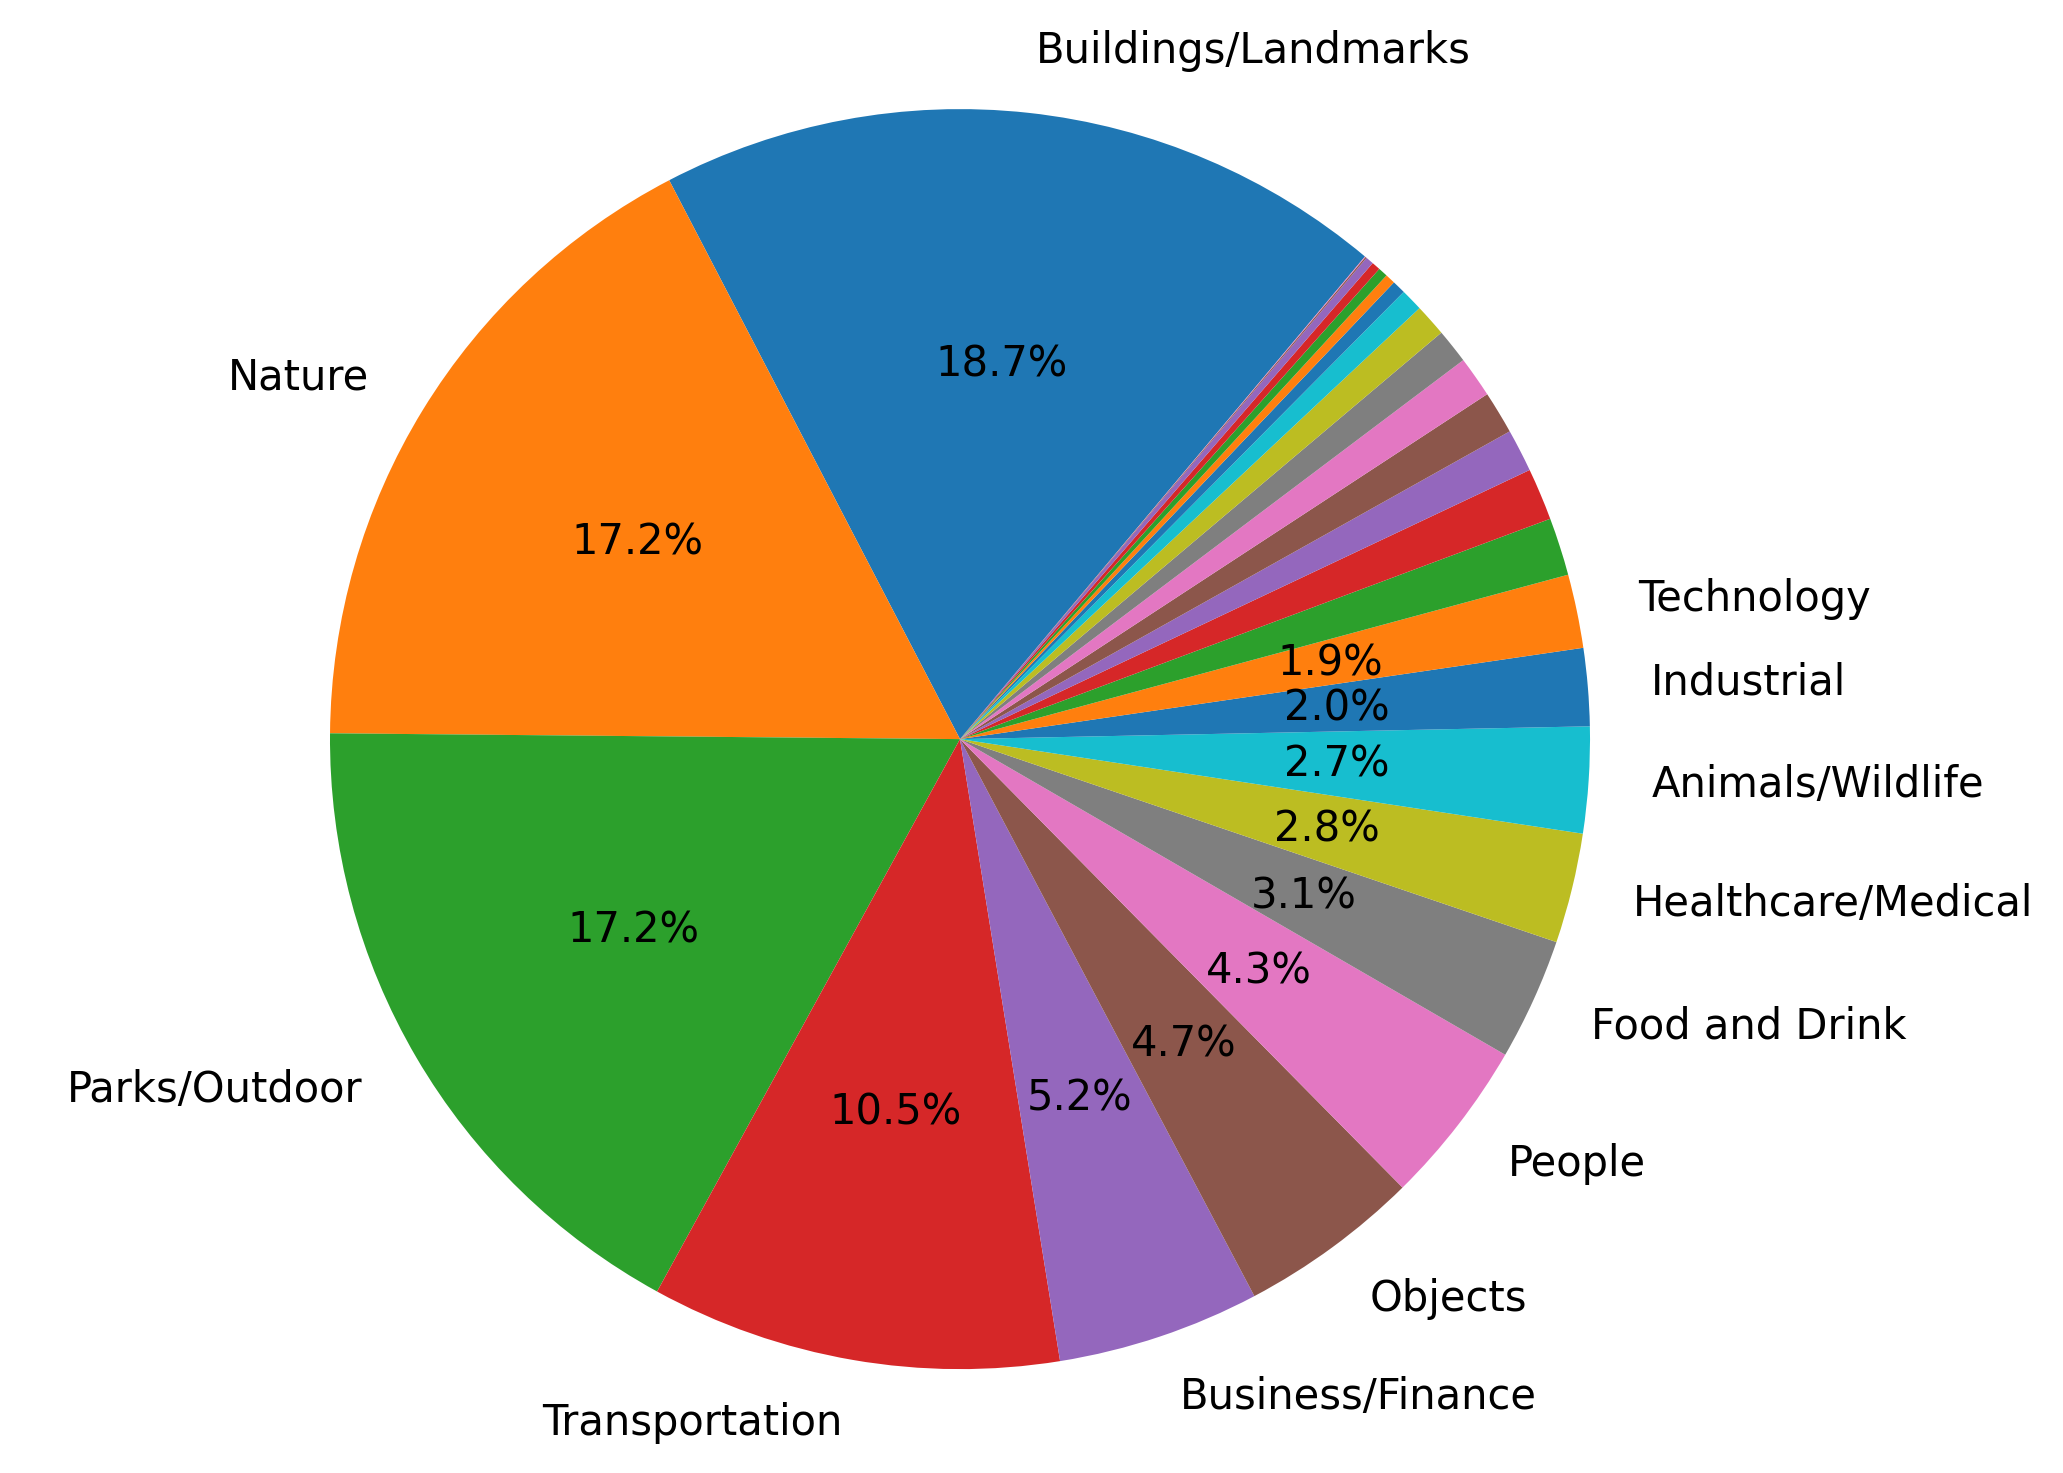
You can notice that there are 4 dominant groups:
| Category | Size (% of total) |
|---|---|
| Buildings/Landmarks | 18.7% |
| Nature | 17.2% |
| Parks/Outdoor | 17.2% |
| Transportation | 10.5% |
Other groups are at least twice as small, starting with Business/Finance with 5.2%.
Earnings per category
Now let’s plot earnings per each category per year from 2007.
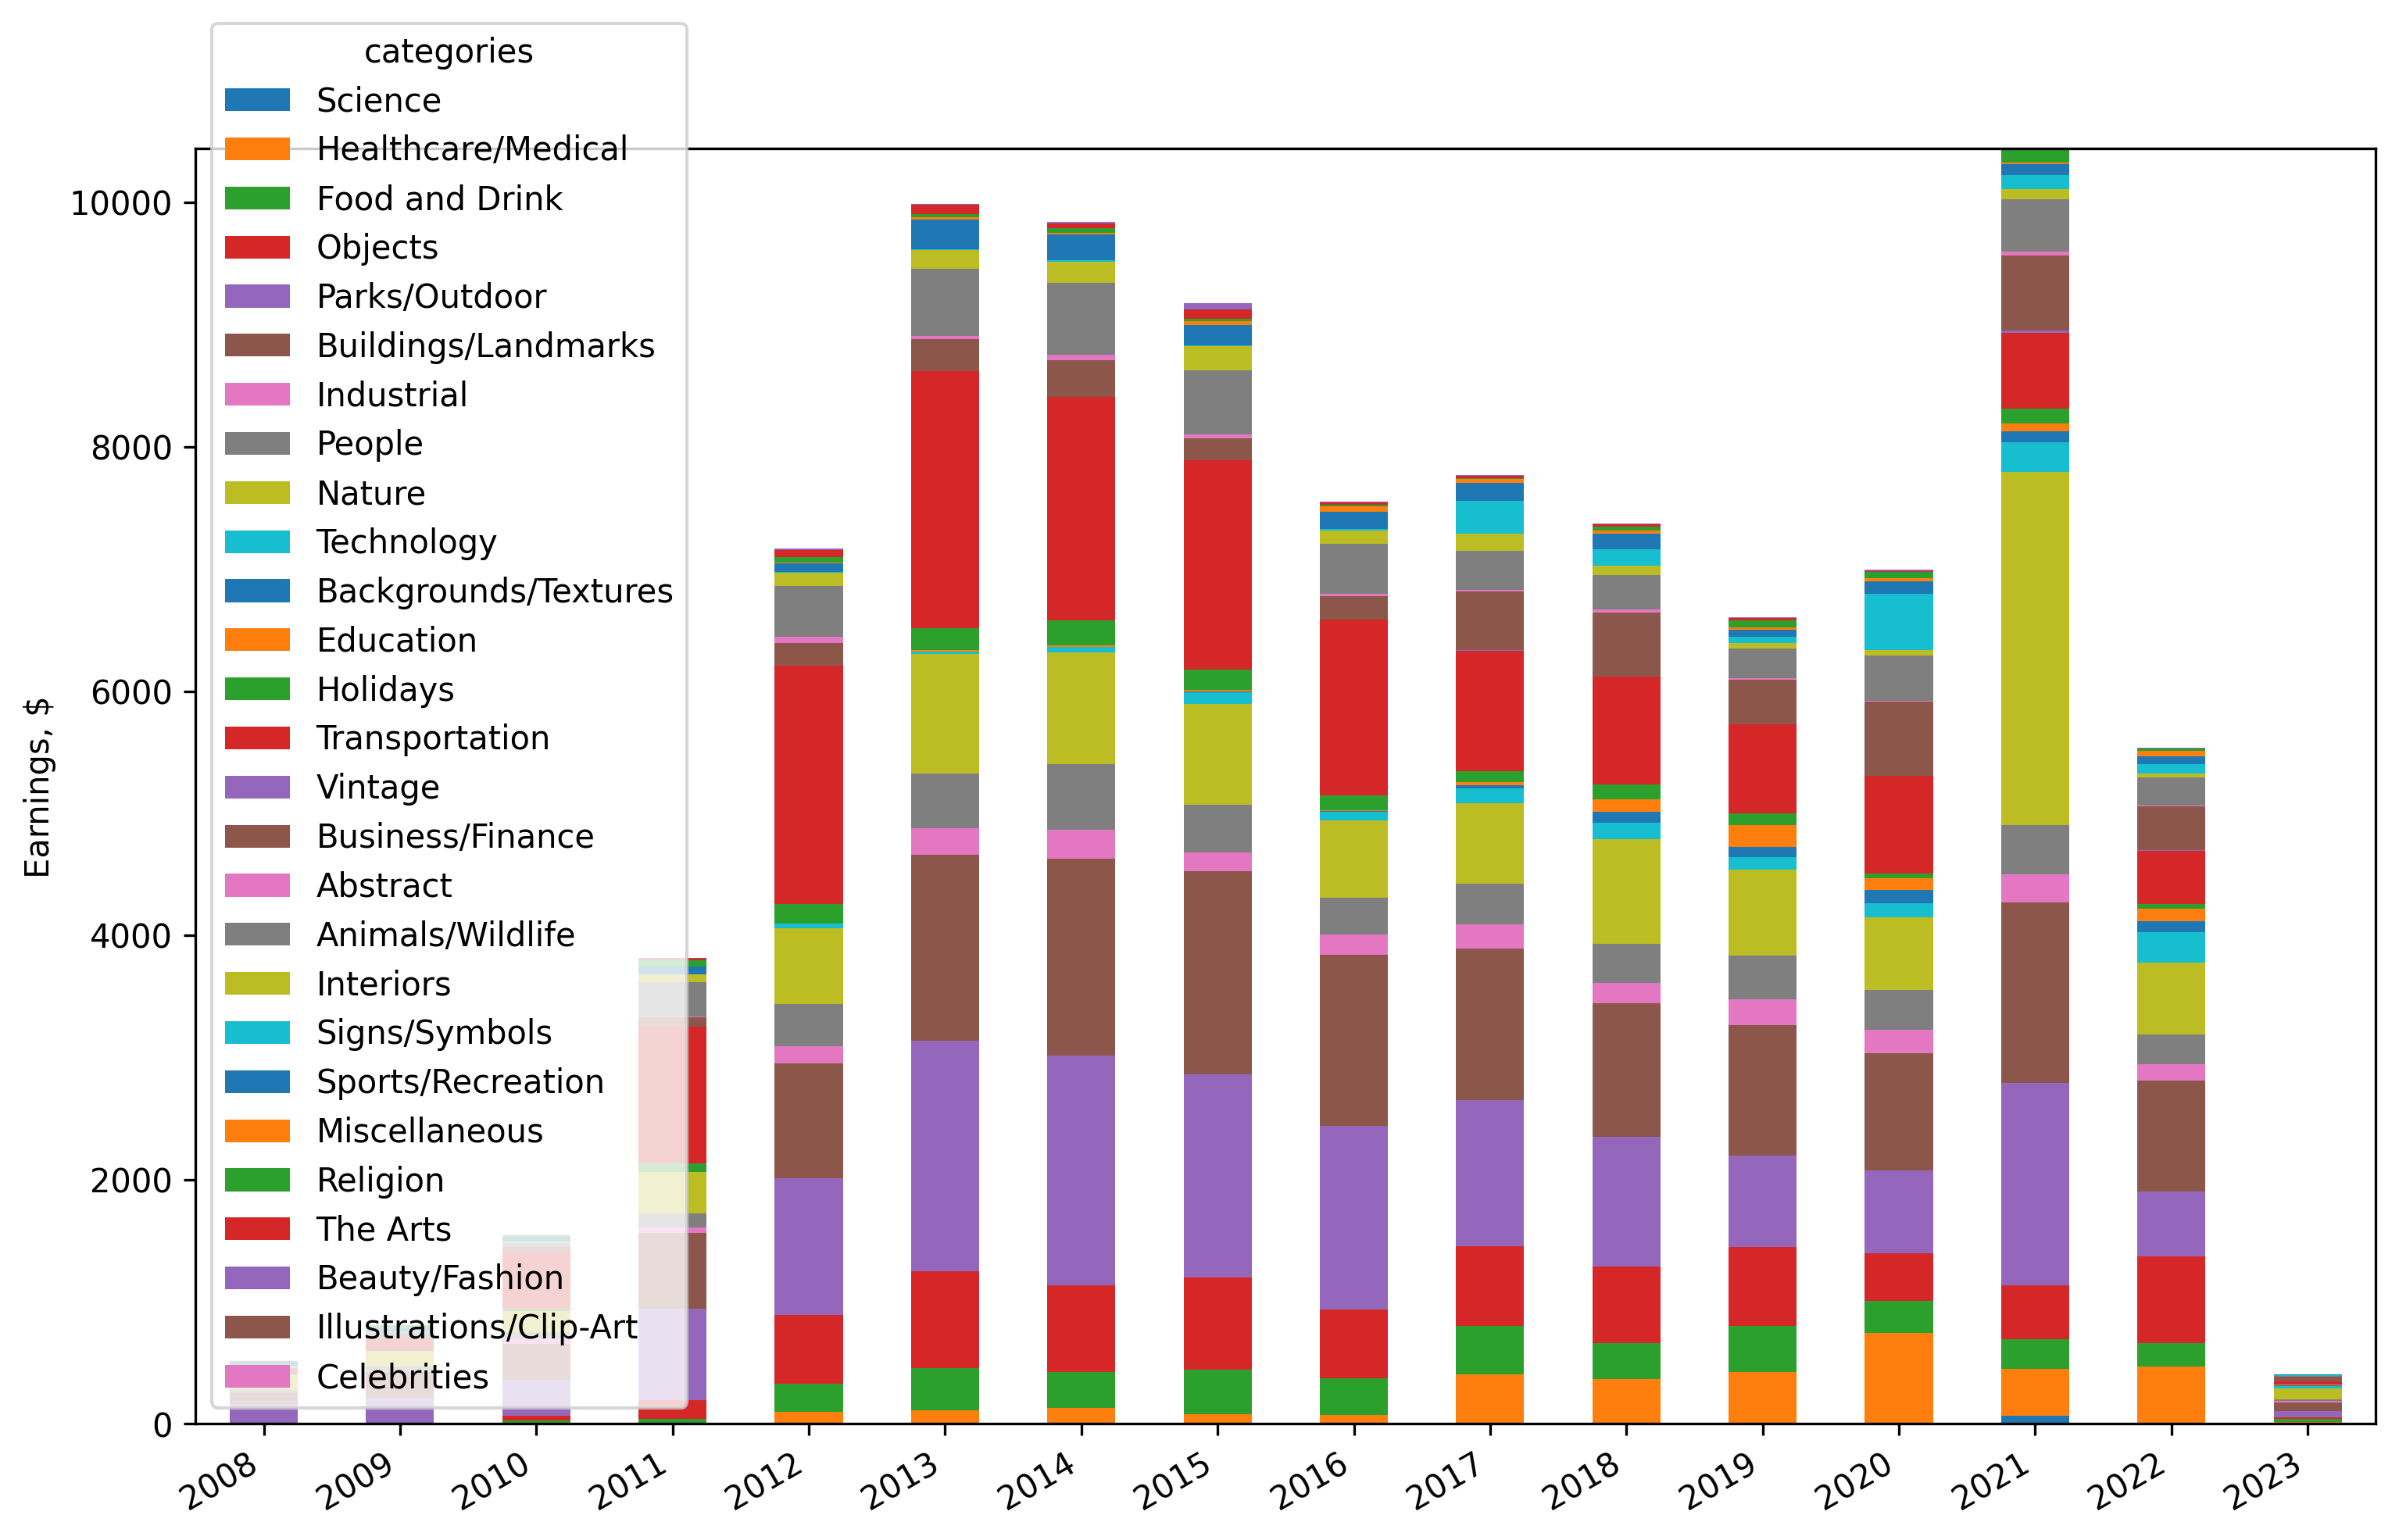
First of all, you can notice that Steve’s portfolio is well diversified! There are substantial sales in multiple categories. In fact, if we group it by category, here’s the split:
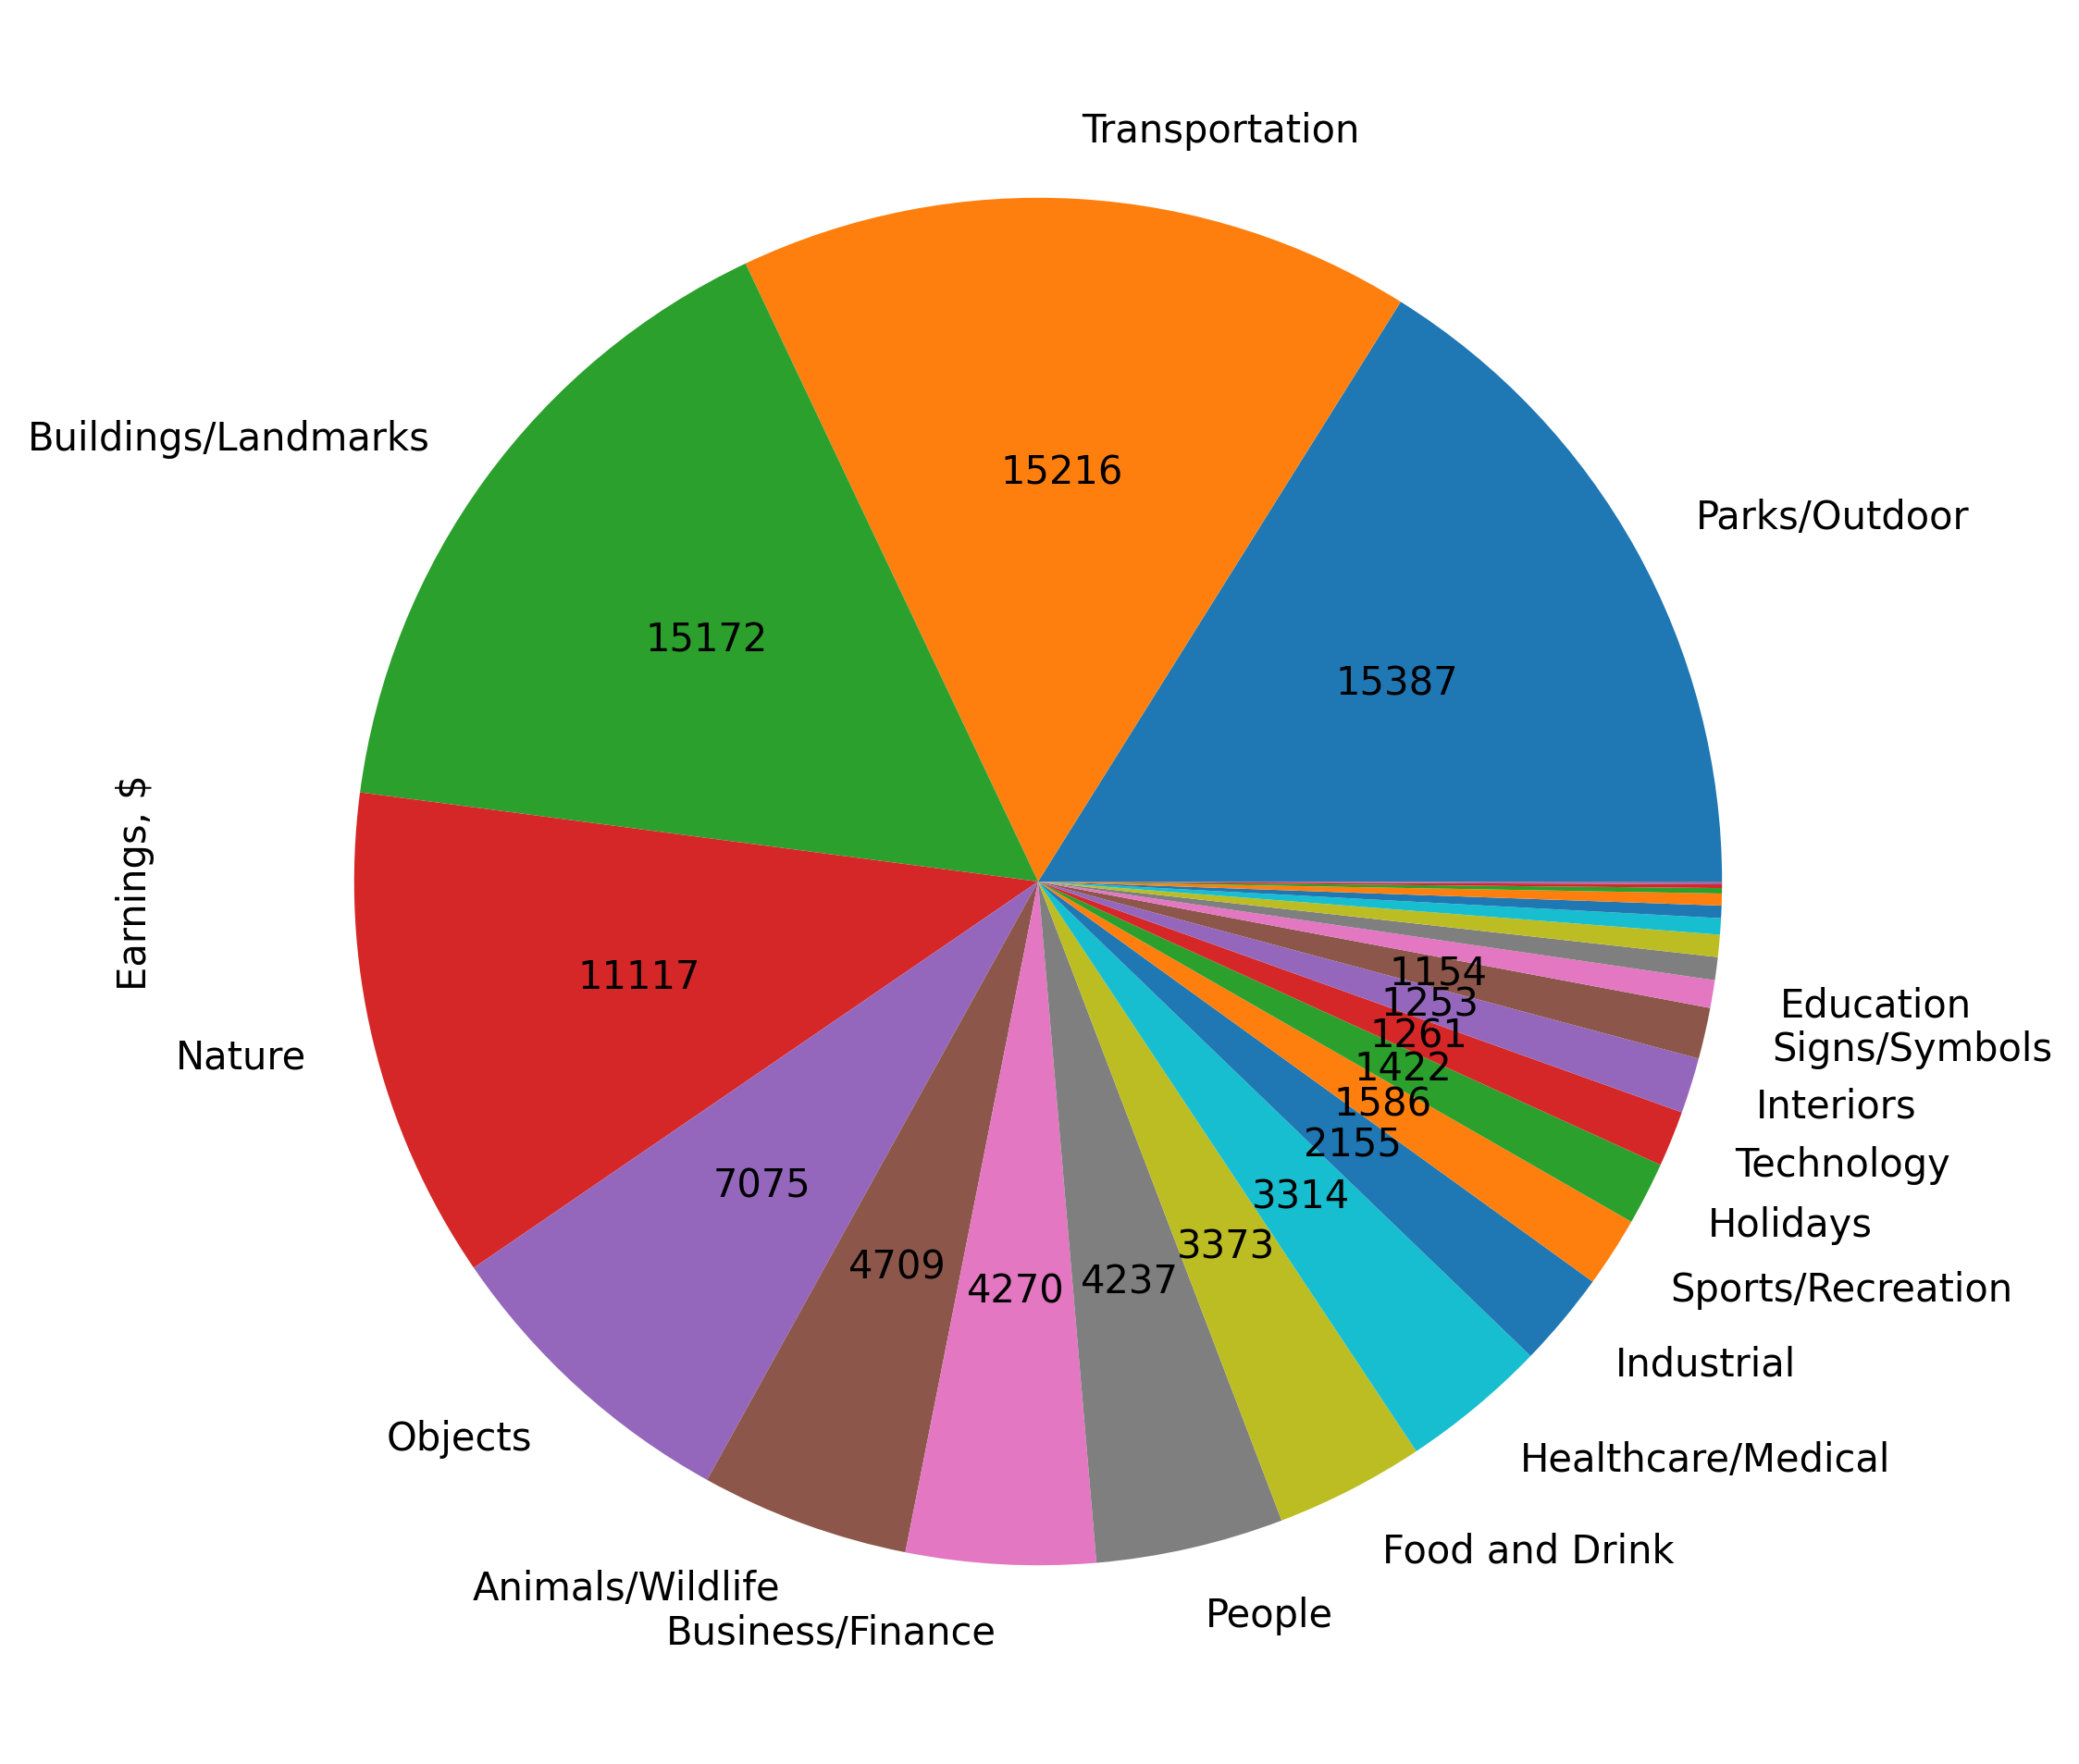
All-time earings grouped by category
Here are the top ones (more than $3,000 in a lifetime):
| Category | Earnings ($) |
|---|---|
| Parks/Outdoor | 15,387 |
| Transportation | 15,216 |
| Buildings/Landmarks | 15,172 |
| Nature | 11,117 |
| Objects | 7,075 |
| Animals/Wildlife | 4,709 |
| Business/Finance | 4,270 |
| People | 4,236 |
| Food and Drink | 3,373 |
| Healthcare/Medical | 3,314 |
It’s easy to see that Parks/Outdoor, Transportation, Buildings/Landmarks and Nature are the absolute top-seller categories. The last one might come as a surprise to many: every microstock “how to earn” guide starts with the guidance to NOT to do nature shots, because agencies are so full of it. However, data does not lie and Steve continues to earn from Nature shots even in 2023.
Here are few of his best-sellers in the top categories:

Best-sellers in Nature, Objects, Buildings and Parks/Outdoors
Concept pictures
There’s 1 nuance here that is not shown by default in the categories chart above. There’s an “unofficial” category known as “Concept shots” that can be used in a situations not directly related to the actual contents of the image. It’s when your image conveys a specific message or is appealing to the customer for a certain cause rather than visuals.
For example, a concept image of a broken lightbulb:

Example of a concept image from Steve's collection
“Concept” can be anything that relates to the context in which the customer is: global warming, social media addiction, food disorders etc. The reason we are looking into it, is that it’s a conventional wisdom to shoot “concept” content as it should sell more.
So as the next quest, we will investigate how Concept category worked for Steve. For this purpose we will use Steve’s keywords and descriptions to see which photos he marked as “Concept”. And we will roughly classify Nature and Parks category as “Nature”.
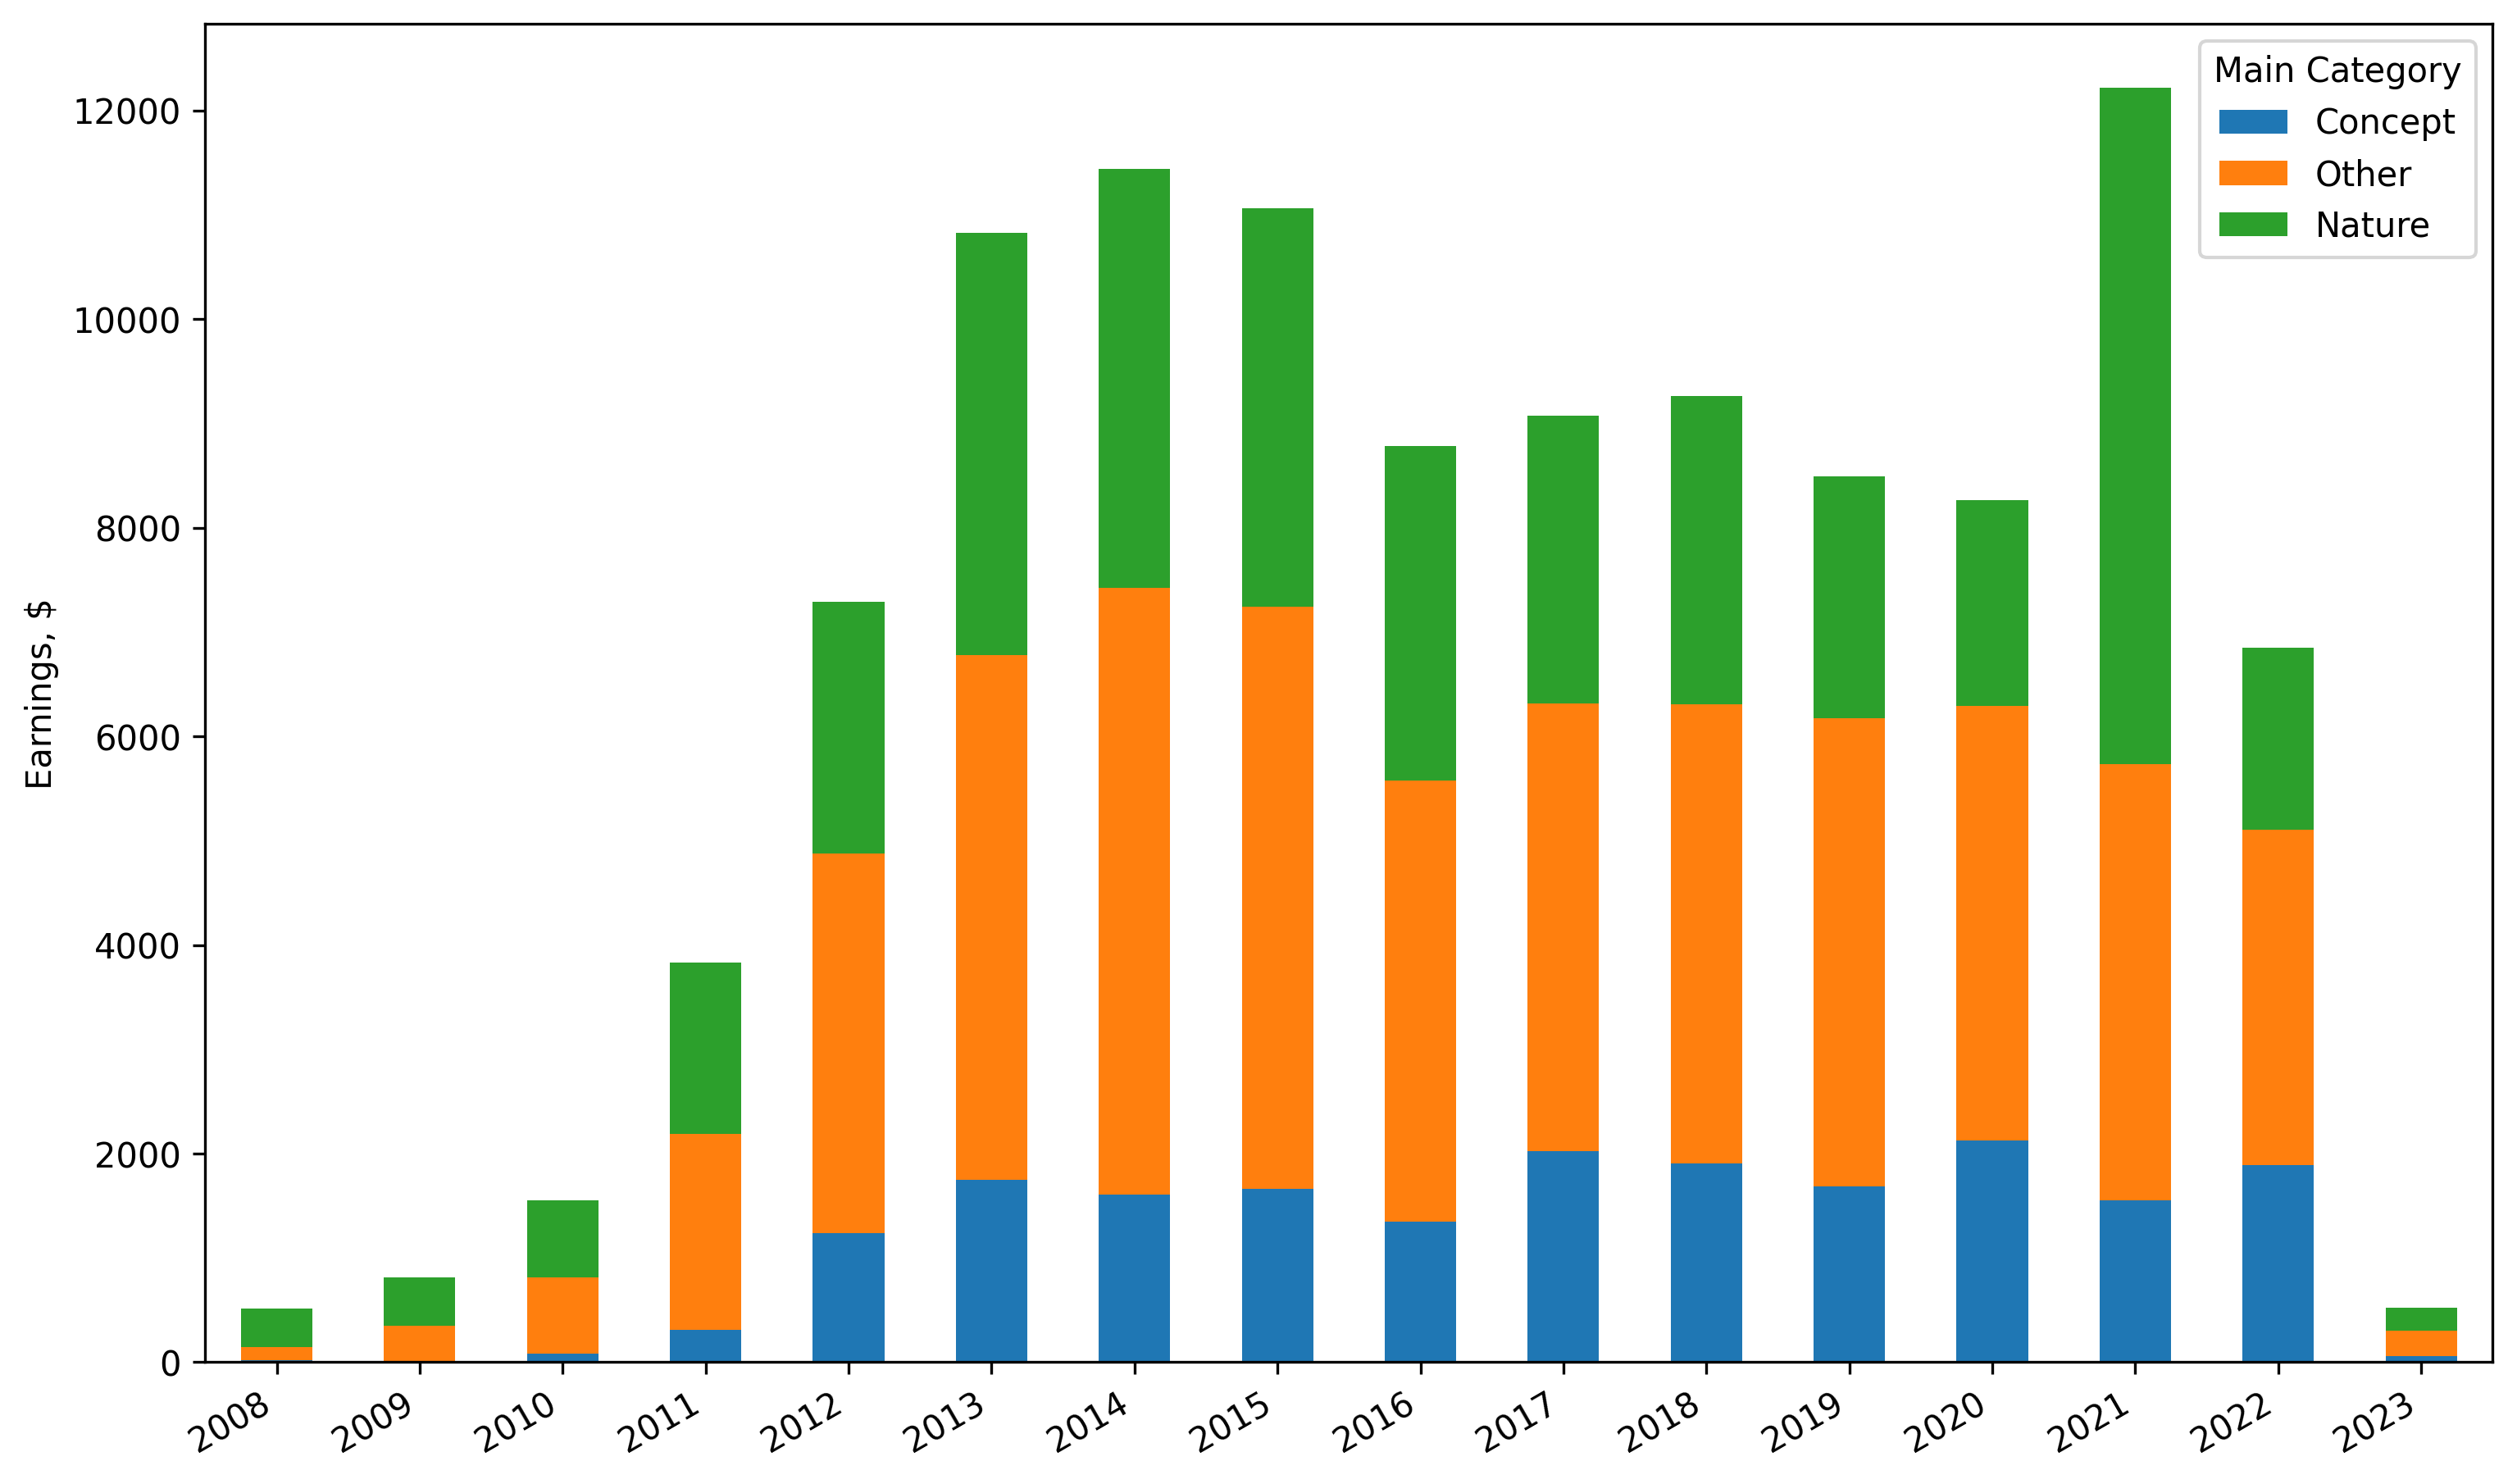
Comparison of Concept vs Nature earnings
It looks like Nature was beating Concept every year so far. It clearly does not show that Concept is useless, but that it possibly was overvalued otherwise.
Adobe Stock earnings
Now that Shutterstock picture is more or less clear, let’s look at the Adobe Stock earnings, split per category. We will only analyze the top-level Adobe Stock category, as each photo is assigned some category in their category tree.
Portfolio composition
Same as with Shutterstock, let’s first take a look at the portfolio composition in general.
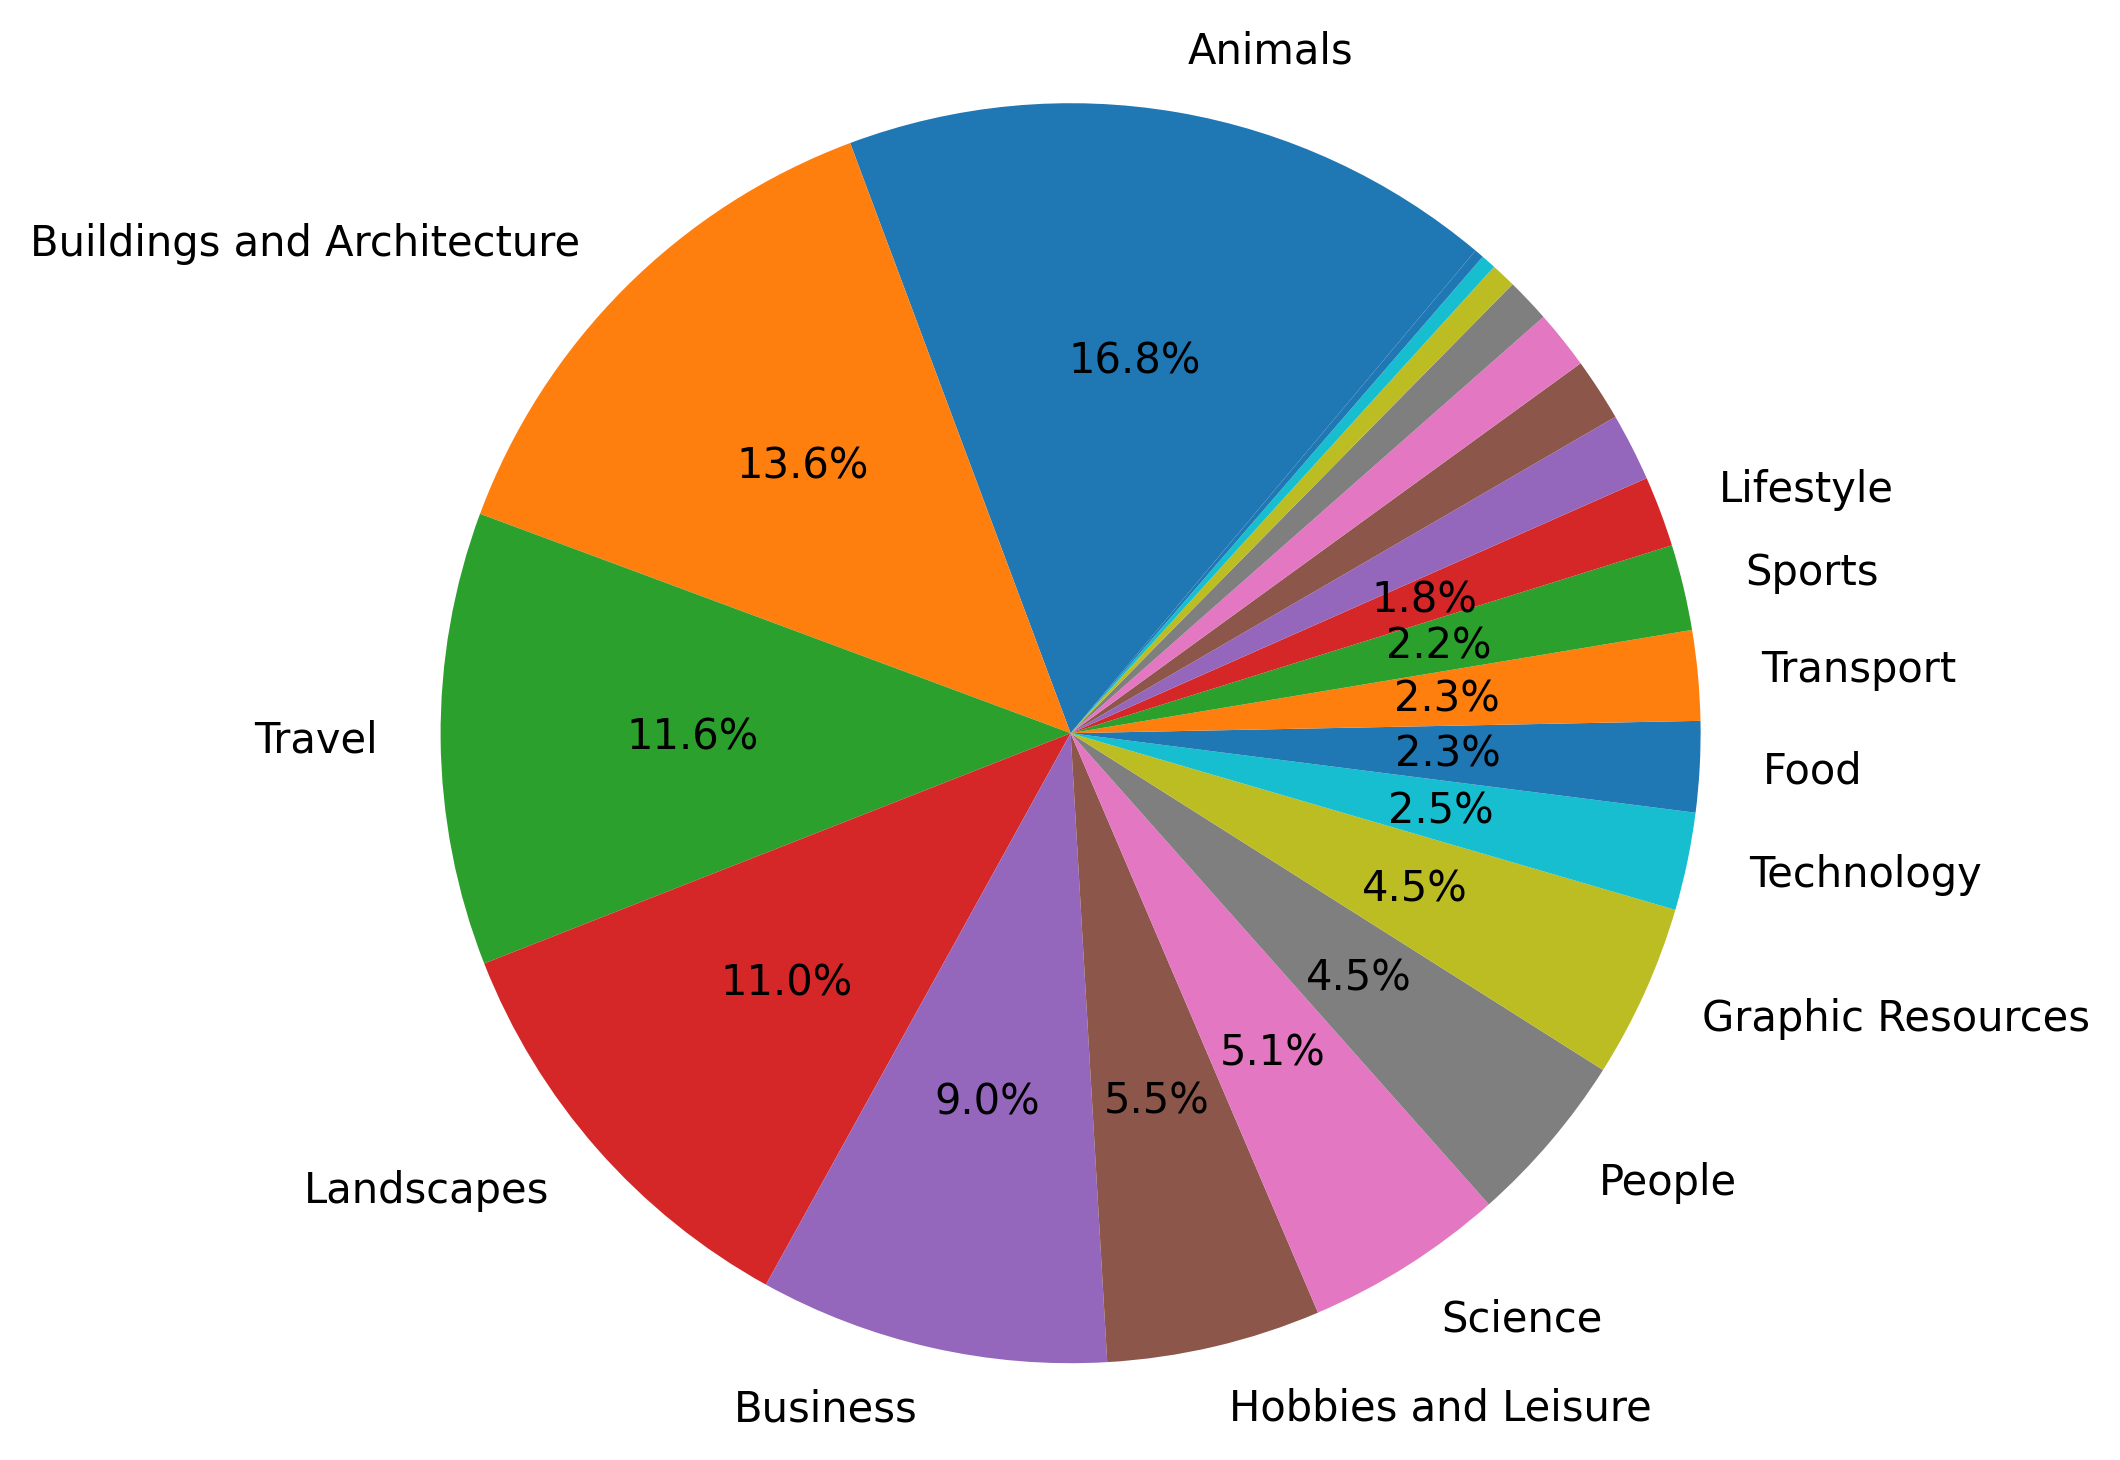
Here the split is different than in Shutterstock and the largest groups are:
| Category | Size (% of total) |
|---|---|
| Animals | 16.8% |
| Buildings and Architecture | 13.6% |
| Travel | 11.6% |
| Landscapes | 11% |
| Business | 9% |
After these 5, there’s a big drop to Hobbies and Leisure at 5.5%.
Earnings per category
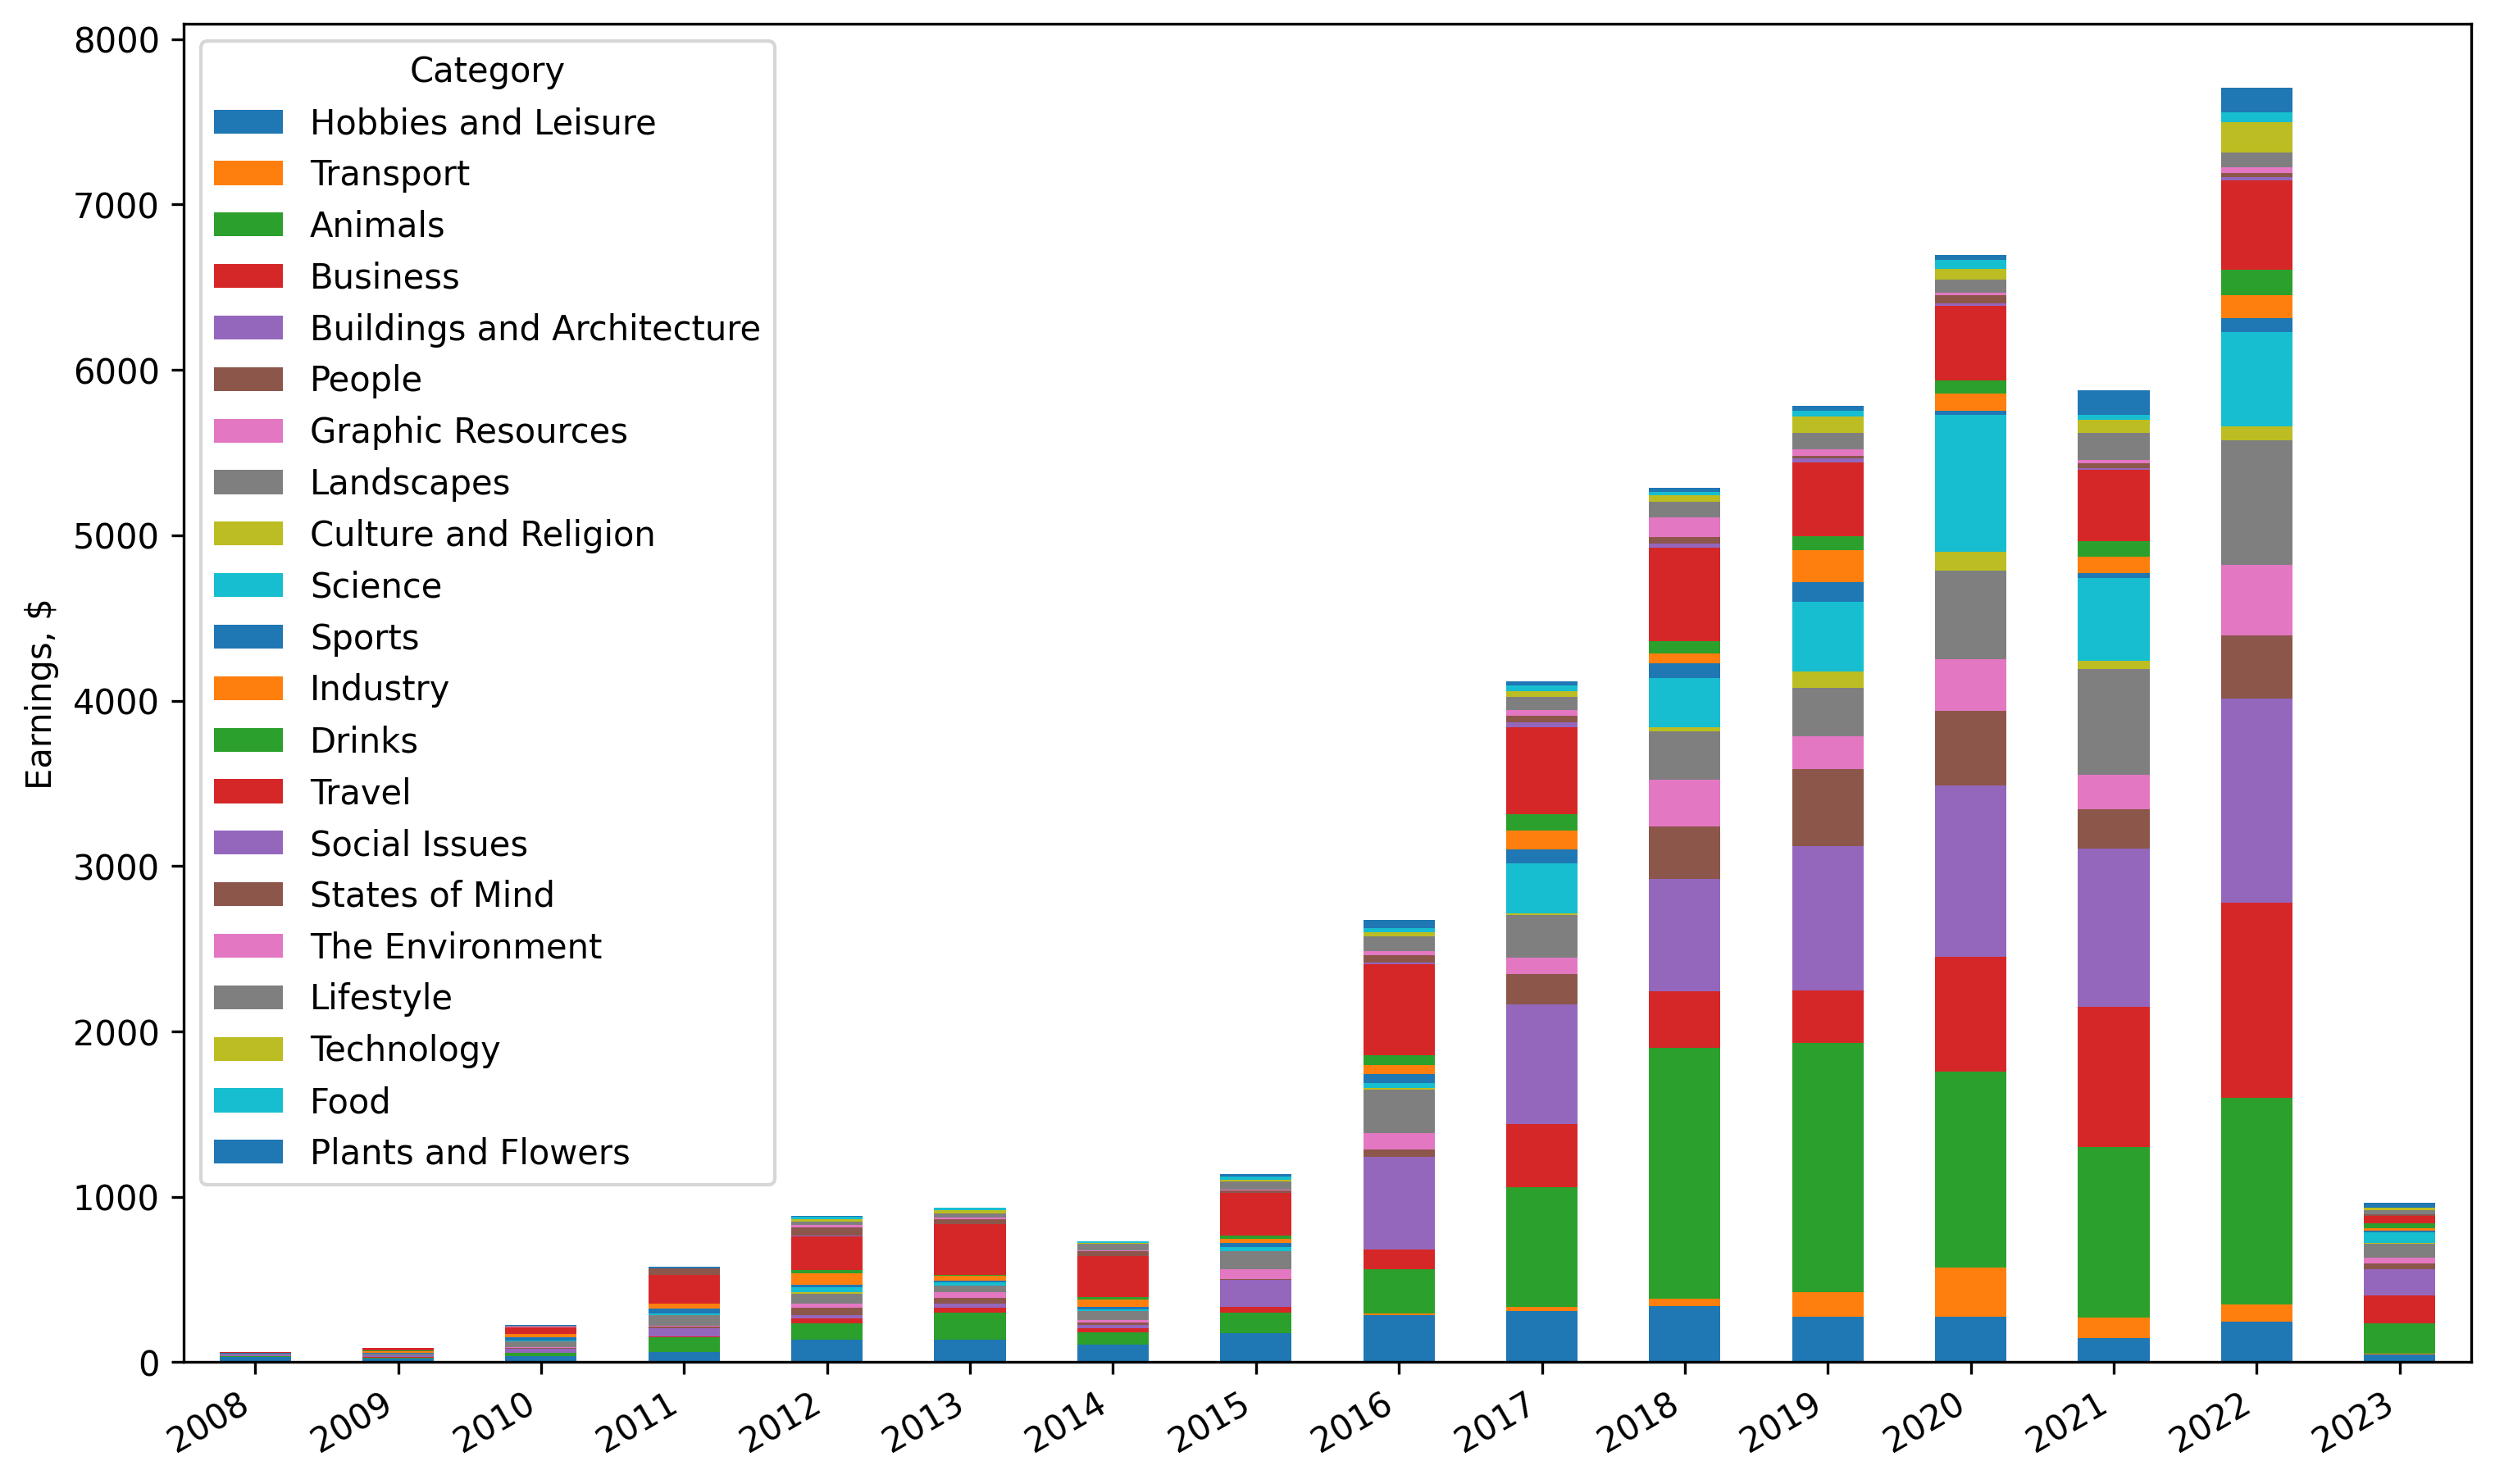
Again earnings here quite diversified without a clear single category that trumps everything else. Now if we get the totals across time in one chart:
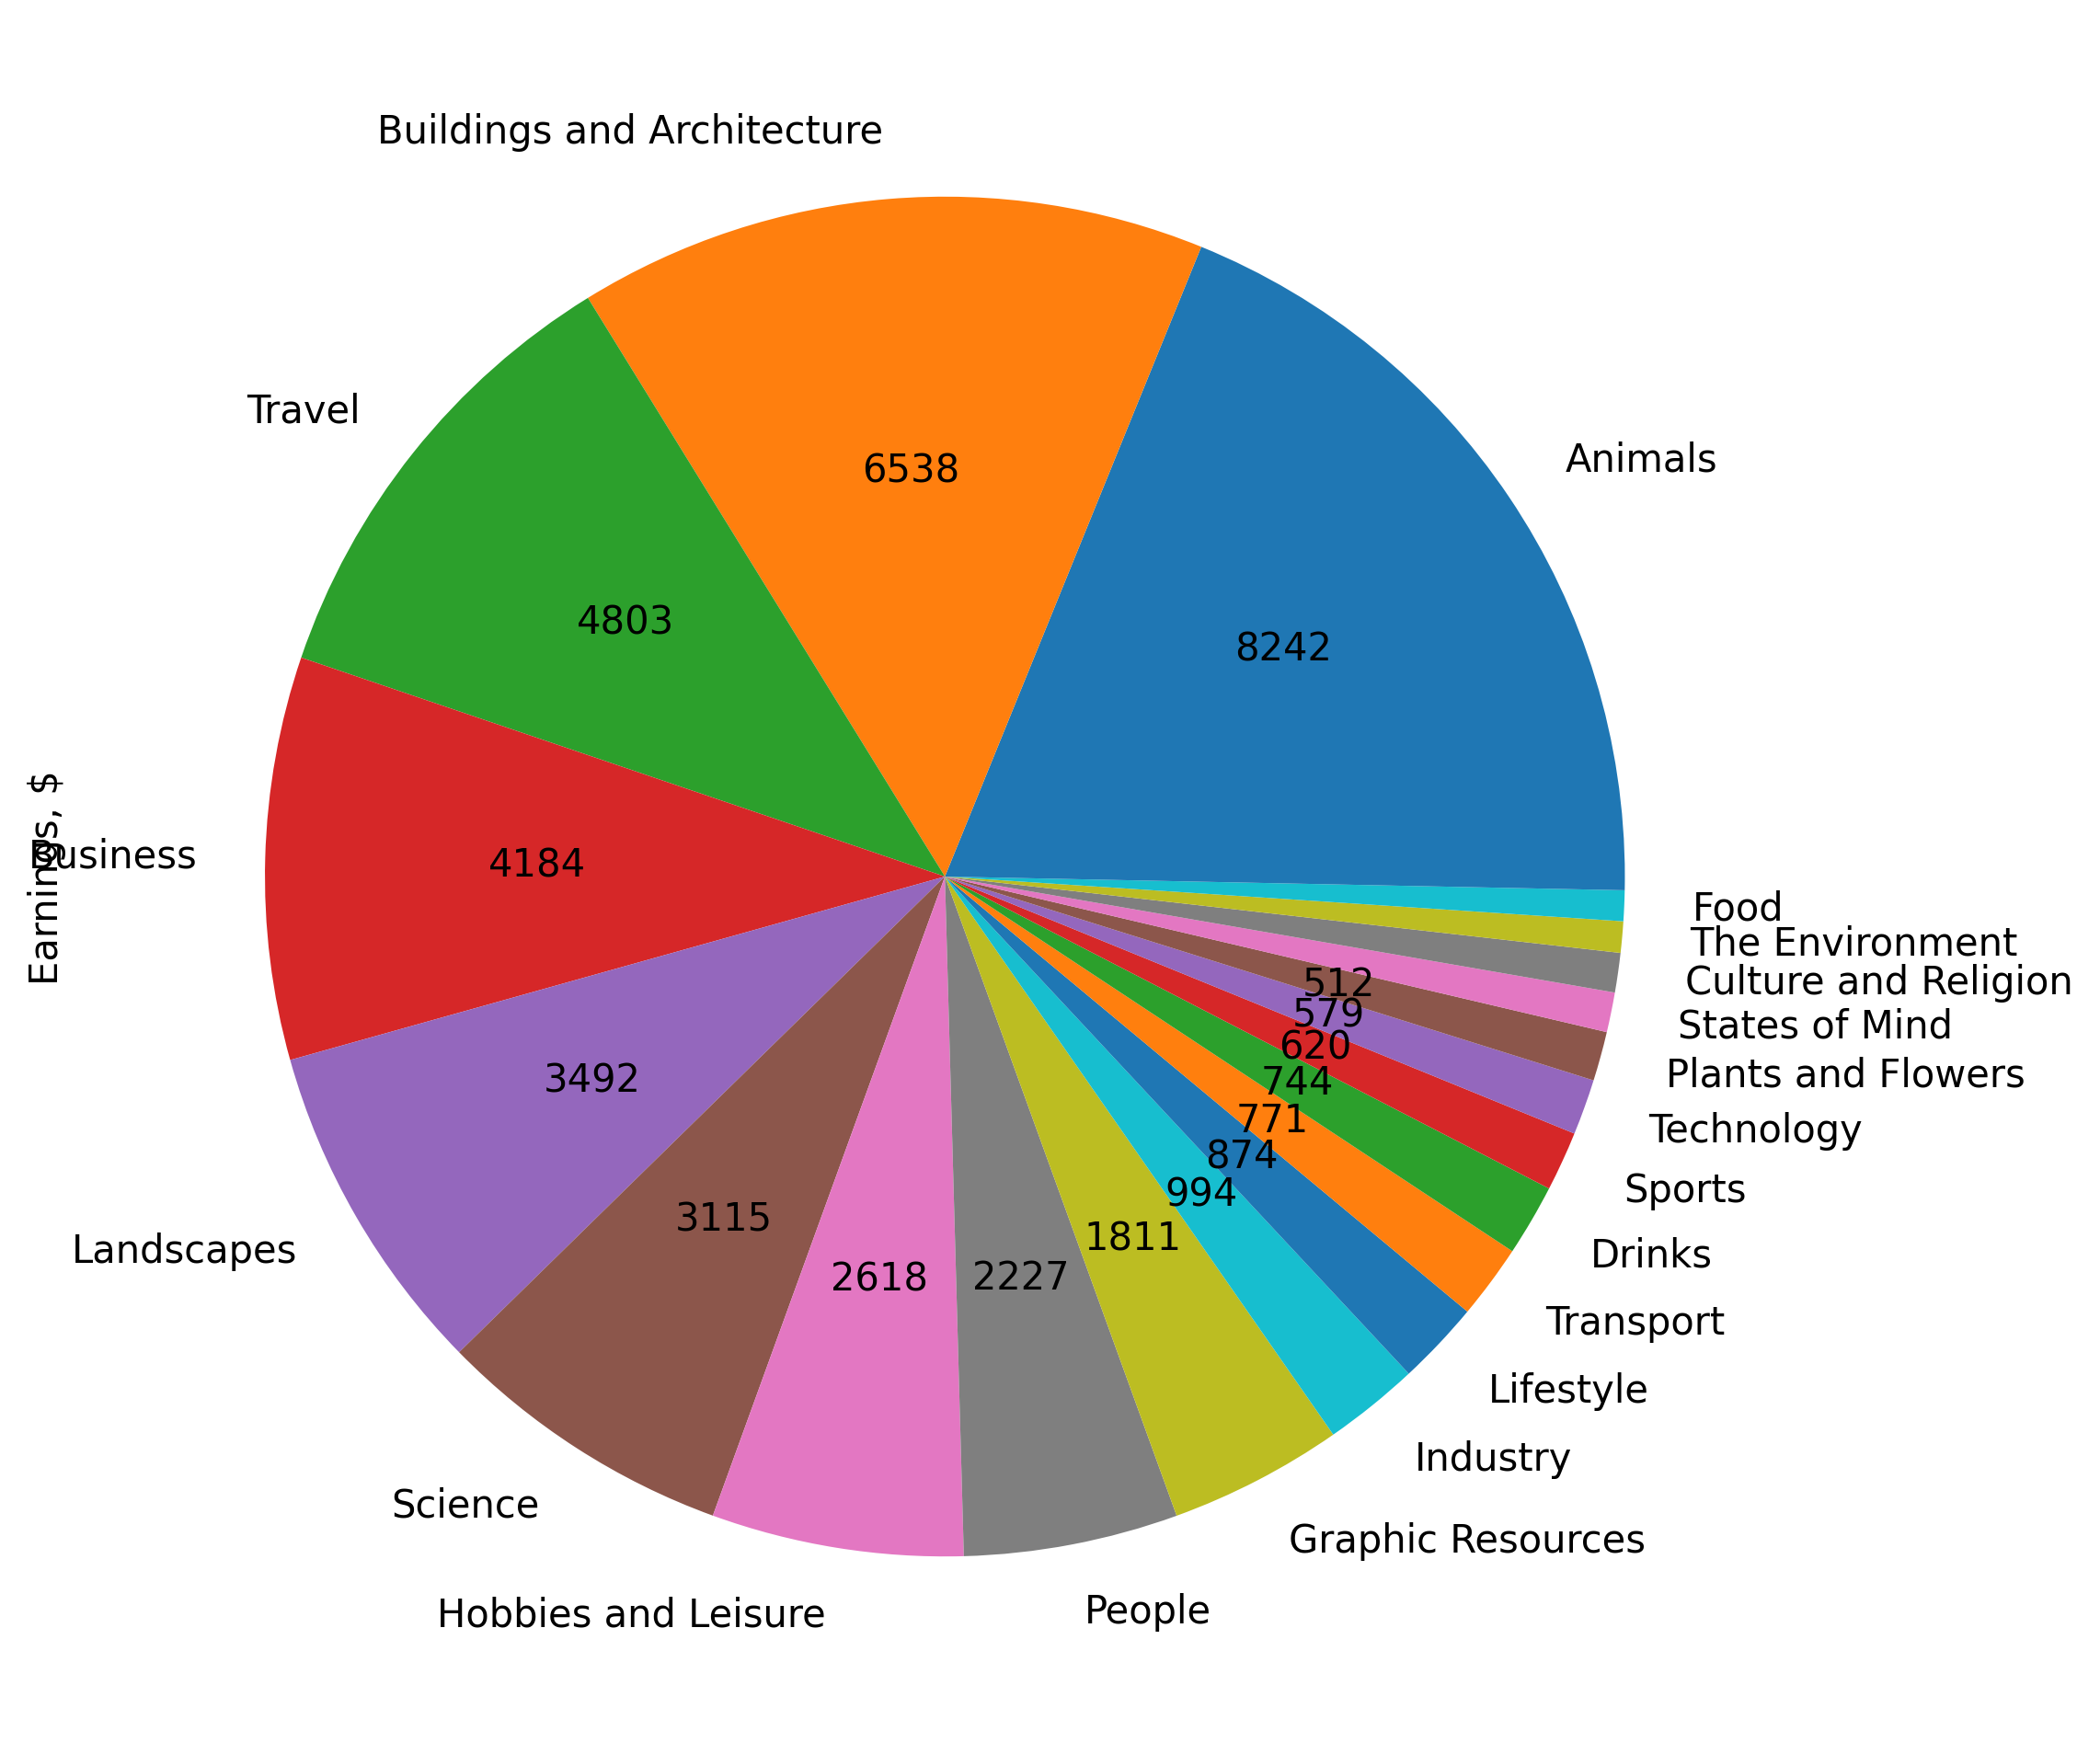
All-time earings grouped by category
With the list of the top-performing categories (with more than $3,000 lifetime earnings):
| Category | Earnings ($) |
|---|---|
| Animals | 8,241 |
| Buildings and Architecture | 6,538 |
| Travel | 4,802 |
| Business | 4,184 |
| Landscapes | 3,491 |
| Science | 3,115 |
The results look somewhat similar to Shutterstock. Obviously, the highest performing assets are probably again pictures of Steve’s cat (see “Best-sellers” section in the previous investigation).
Concept pictures
Looking at concept images at Adobe Stock, the picture is a bit different though:
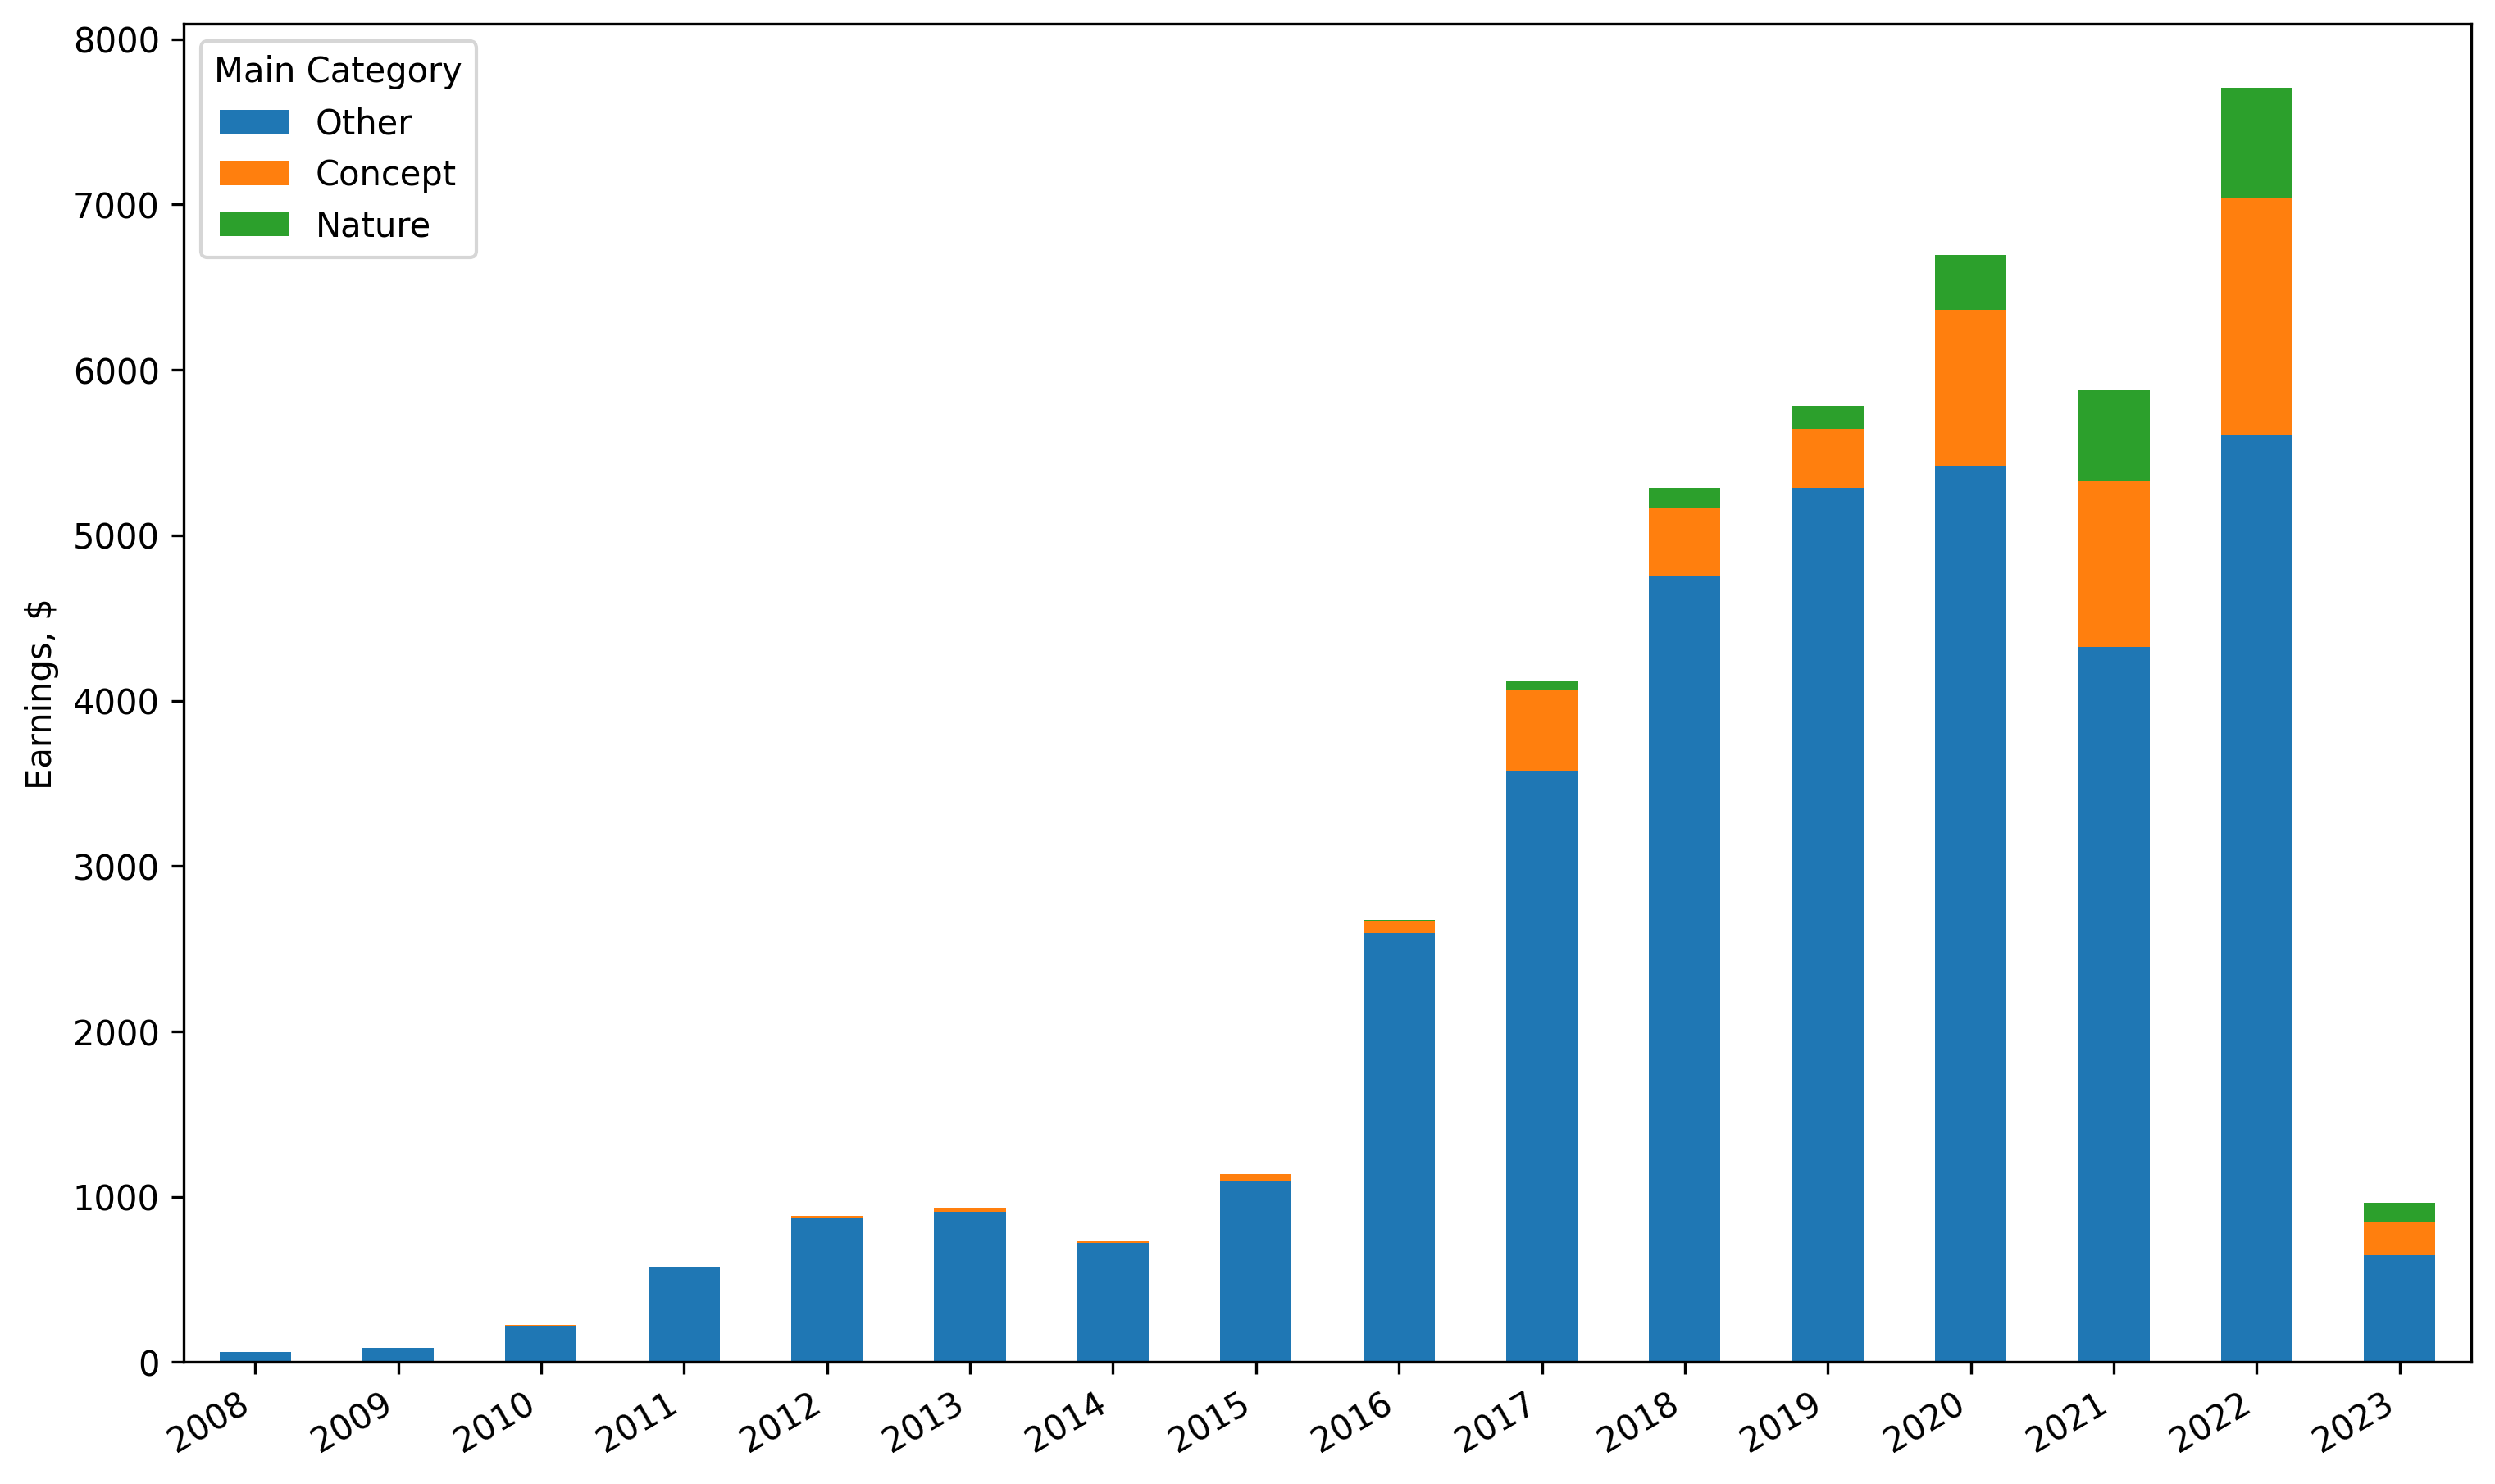
Concept vs Nature at Adobe Stock
It’s clear that here Concept images were performing better than Nature images.
Conclusion
Note that these results are based on total earnings and not category ROI (e.g. relative to cost to produce)
If there’s a single takeaway from this study, I’d say it’s that “common knowledge” can mislead you. Cliche content categories, such as “Nature” and “Travel” were some of the highest performers for Steve. Of course, it will not directly translate to you, but hopefully gives you something to think about. Note that it’s best to blend where your skills are strong and topics that sell better than others (otherwise, do not hope for “get-rich-quick” success).
Another interesting thing is that on Adobe Stock top categories by earnings are proportional to the size of each category in terms of files. The only exception was “Business” category, that was in the top sellers, but had proportionally less files, than others. As for Shutterstock, the distribution of earnings was not exactly proportional to the size of category, but of the same ballpark - top earners were among the largest, but mixed in order.
Make sure to check out the previous study if you haven’t done so yet and also check out Steve’s blog too.


